33
/es/
AIzaSyB4mHJ5NPEv-XzF7P6NDYXjlkCWaeKw5bc
November 1, 2025
249493
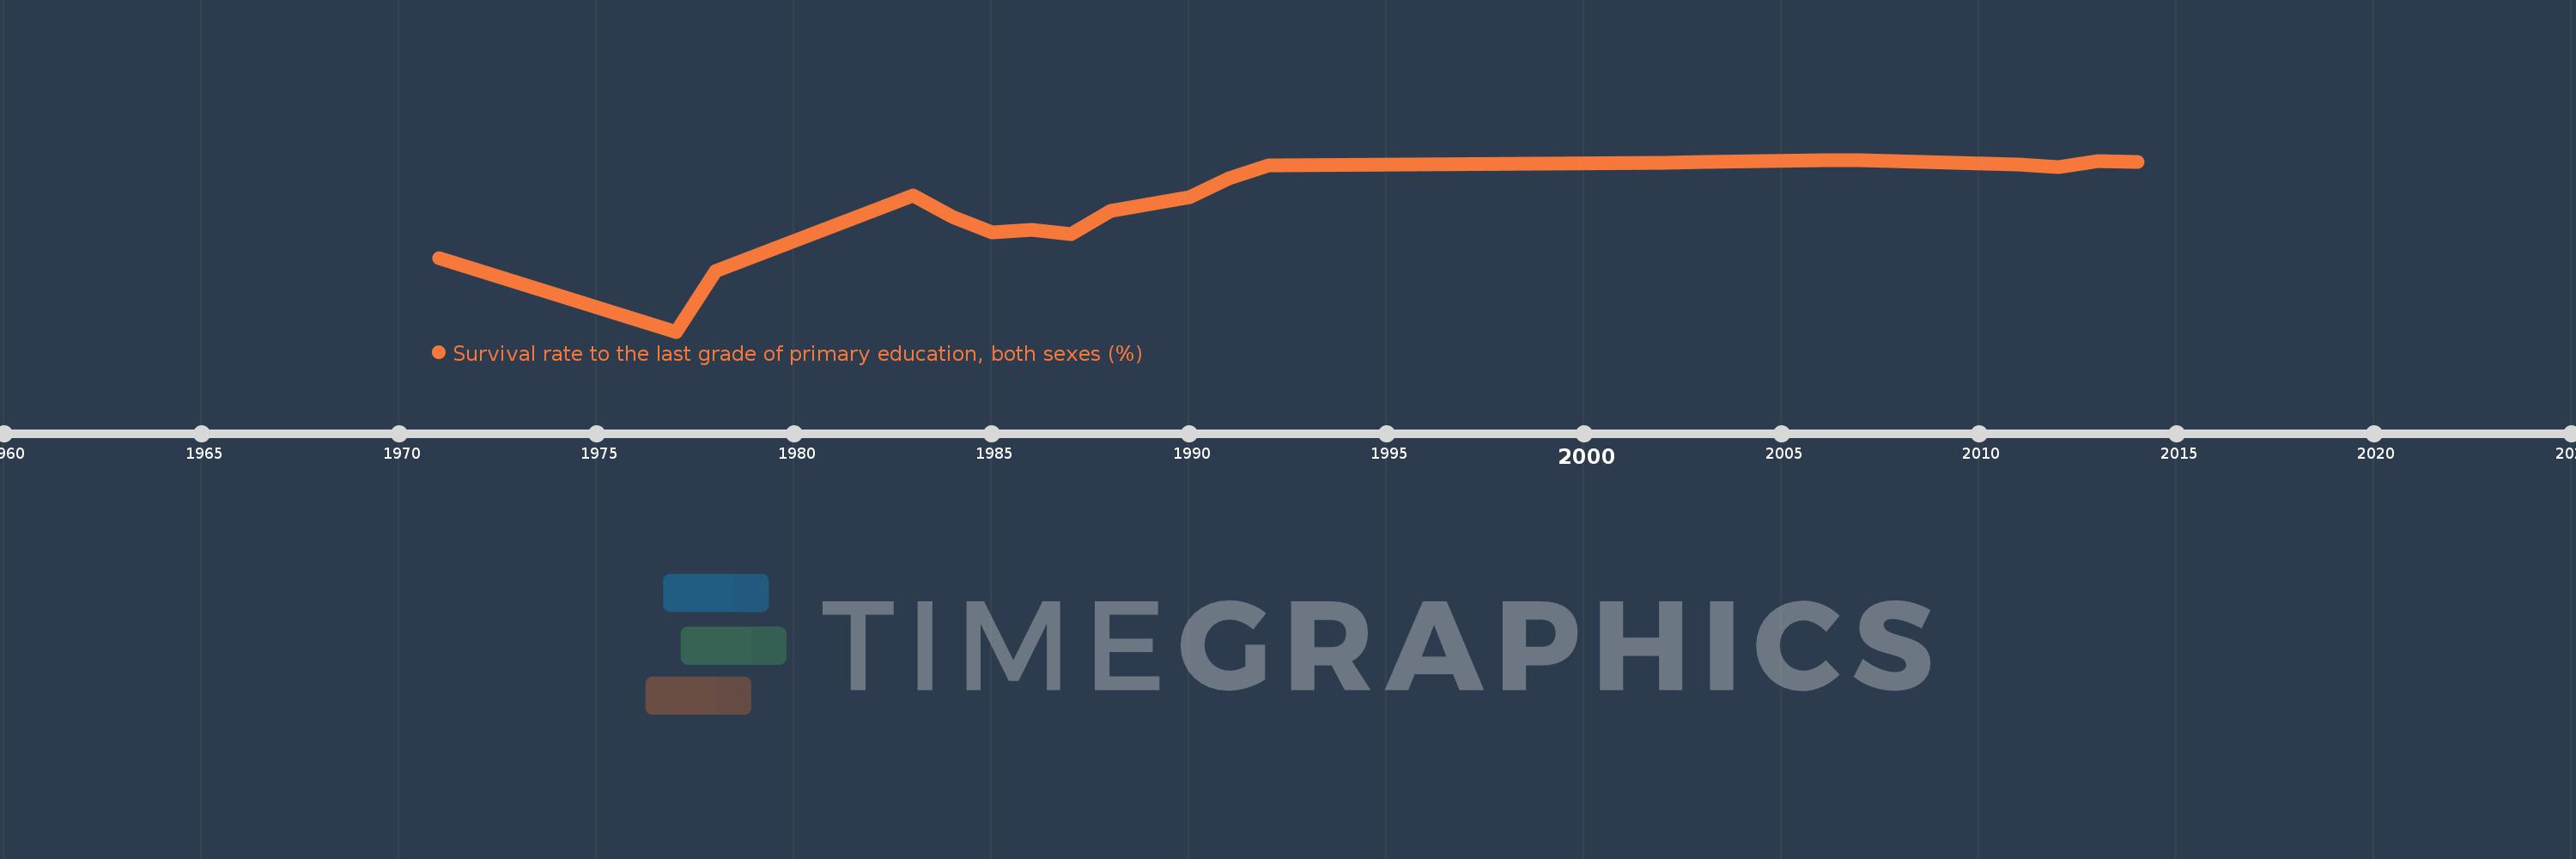
Sri Lanka
LKA
true
2
1
Survival rate to the last grade of primary education, both sexes (%)
2014,2013,2012,2011,2007,2006,2003,2002,1992,1991,1990,1988,1987,1986,1985,1984,1983,1978,1977,1971