33
/es/
AIzaSyAYiBZKx7MnpbEhh9jyipgxe19OcubqV5w
August 1, 2025
247869
Spain
ESP
true
2
1
Net lending (+) / net borrowing (-) (% of GDP)
1997,1995,1994,1993,1992,1991,1990,1989,1988,1987,1986,1985,1984,1983,1982,1981,1980,1979,1978,1977,1976,1975,1974,1973
Download
Estadísticas Globales de la Biblioteca →Spain →

Net lending (+) / net borrowing (-) (% of GDP)

Estas estadísticas en otros países:

AfghanistanAlbaniaAlgeriaAngolaAntigua and BarbudaArmeniaAustraliaAustriaAzerbaijanBahamas, TheBahrainBangladeshBarbadosBelarusBelgiumBelizeBhutanBoliviaBosnia and HerzegovinaBrazilBurundiCabo VerdeCambodiaCanadaCaribbean small statesCentral African RepublicCentral Europe and the BalticsChileCongo, Dem. Rep.Congo, Rep.Costa RicaCote d'IvoireCroatiaCyprusCzech RepublicDenmarkDominicaDominican RepublicEarly-demographic dividendEgypt, Arab Rep.El SalvadorEquatorial GuineaEstoniaEthiopiaEuro areaEurope & Central AsiaEurope & Central Asia (excluding high income)Europe & Central Asia (IDA & IBRD countries)European UnionFijiFinlandFranceGambia, TheGeorgiaGermanyGreeceGuatemalaHigh incomeHondurasHungaryIcelandIDA blendIndiaIndonesiaIran, Islamic Rep.IraqIrelandIsraelItalyJamaicaKazakhstanKiribatiKorea, Rep.Kyrgyz RepublicLao PDRLatin America & Caribbean Latin America & Caribbean (excluding high income)Latin America & the Caribbean (IDA & IBRD countries)LatviaLebanonLithuaniaLower middle incomeLuxembourgMacao SAR, ChinaMacedonia, FYRMadagascarMalawiMaldivesMaliMaltaMauritiusMexicoMicronesia, Fed. Sts.Middle East & North Africa (excluding high income)Middle East & North Africa (IDA & IBRD countries)MoldovaMongoliaMoroccoMozambiqueNamibiaNepalNetherlandsNew ZealandNicaraguaNigeriaNorth AmericaNorwayOECD membersOmanOther small statesPacific island small statesPakistanParaguayPeruPhilippinesPolandPortugalPost-demographic dividendQatarRomaniaRussian FederationRwandaSamoaSan MarinoSao Tome and PrincipeSenegalSerbiaSierra LeoneSingaporeSlovak RepublicSmall statesSolomon IslandsSouth AfricaSouth AsiaSouth Asia (IDA & IBRD)SpainSri LankaSub-Saharan Africa Sub-Saharan Africa (excluding high income)Sub-Saharan Africa (IDA & IBRD countries)SurinameSwazilandSwedenSwitzerlandSyrian Arab RepublicThailandTimor-LesteTrinidad and TobagoTurkeyUgandaUkraineUnited Arab EmiratesUnited KingdomUnited StatesUruguayVanuatuVietnamWest Bank and GazaWorldYemen, Rep.Zimbabwe

línea de tiempo (timeline):

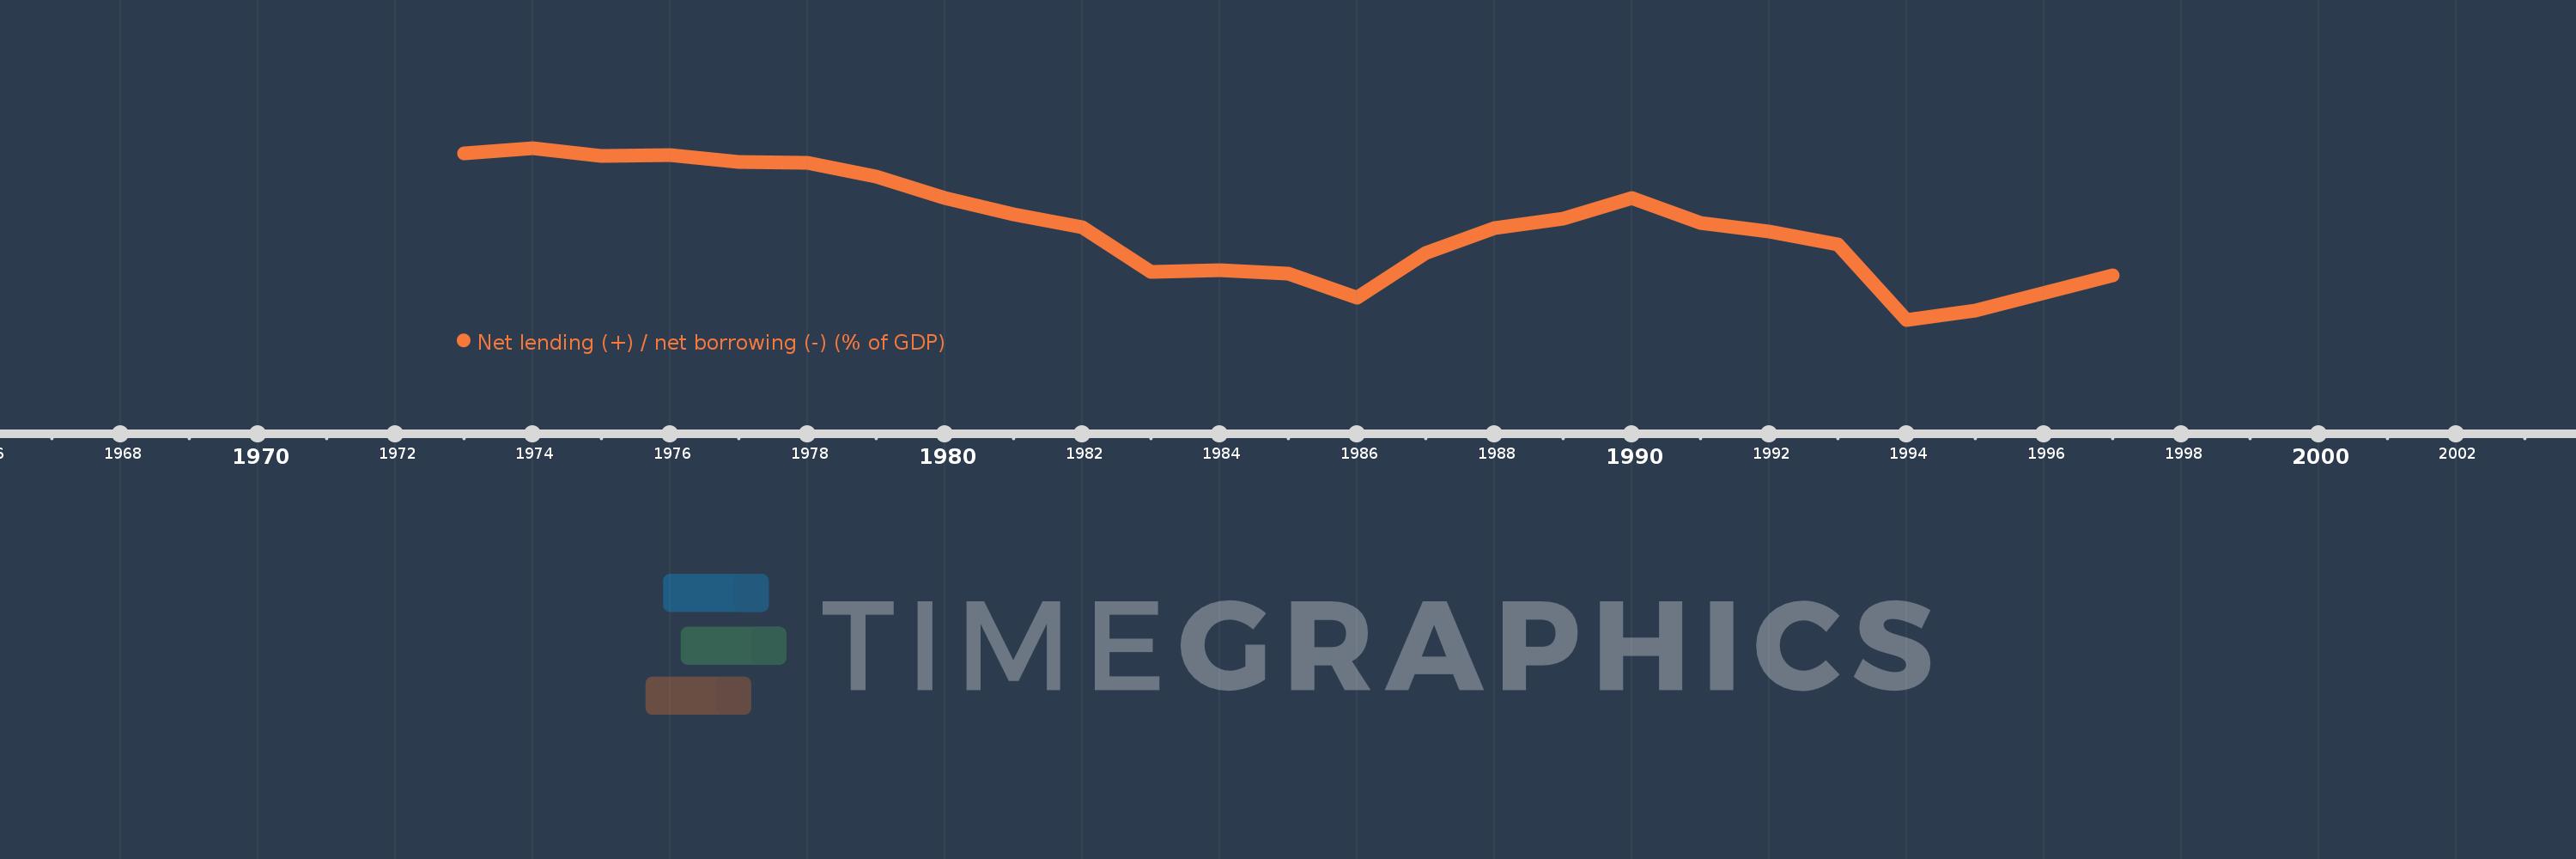
En esta escala de tiempo se presenta un gráfico de 1973 y 1997 de Spain. Los datos de 1972 están ausentes. El número de observaciones reales por fecha: 24.

Fuente (nombre):

Indicadores del desarrollo mundial

Fuente (organización):

International Monetary Fund, Government Finance Statistics Yearbook and data files.

Categorías:

Public Sector

Se ha actualizado:

23 abr 2017 año

Los indicadores de los cambios de valor en los últimos años

En promedio:
-2.64
Mínimo:
-6.512
1 ene 1994 año
Máximo:
0.418
1 ene 1974 año
A la fecha de observación
Valor
Cambio absoluto
El cambio con respecto al valor anterior
1 ene 1973 año
0.195
+0.195
0.0%
1 ene 1974 año
0.418
+0.223
114.09%
1 ene 1975 año
0.104
-0.314
-75.2%
1 ene 1976 año
0.132
+0.029
27.75%
1 ene 1977 año
-0.133
-0.265
-200.29%
1 ene 1978 año
-0.182
-0.05
37.36%
1 ene 1979 año
-0.737
-0.555
304.05%
1 ene 1980 año
-1.611
-0.874
118.58%
1 ene 1981 año
-2.269
-0.659
40.88%
1 ene 1982 año
-2.778
-0.508
22.4%
1 ene 1983 año
-4.591
-1.814
65.3%
1 ene 1984 año
-4.503
+0.089
-1.93%
1 ene 1985 año
-4.663
-0.16
3.55%
1 ene 1986 año
-5.638
-0.976
20.92%
1 ene 1987 año
-3.821
+1.817
-32.22%
1 ene 1988 año
-2.828
+0.994
-26.0%
1 ene 1989 año
-2.428
+0.4
-14.14%
1 ene 1990 año
-1.587
+0.841
-34.64%
1 ene 1991 año
-2.6
-1.013
63.84%
1 ene 1992 año
-2.962
-0.362
13.94%
1 ene 1993 año
-3.483
-0.521
17.59%
1 ene 1994 año
-6.512
-3.029
86.95%
1 ene 1995 año
-6.148
+0.364
-5.59%
1 ene 1997 año
-4.729
+1.419
-23.08%

Ranking de los países por los datos estadísticos actuales