Download Estas estadísticas en otros países:
línea de tiempo (timeline):
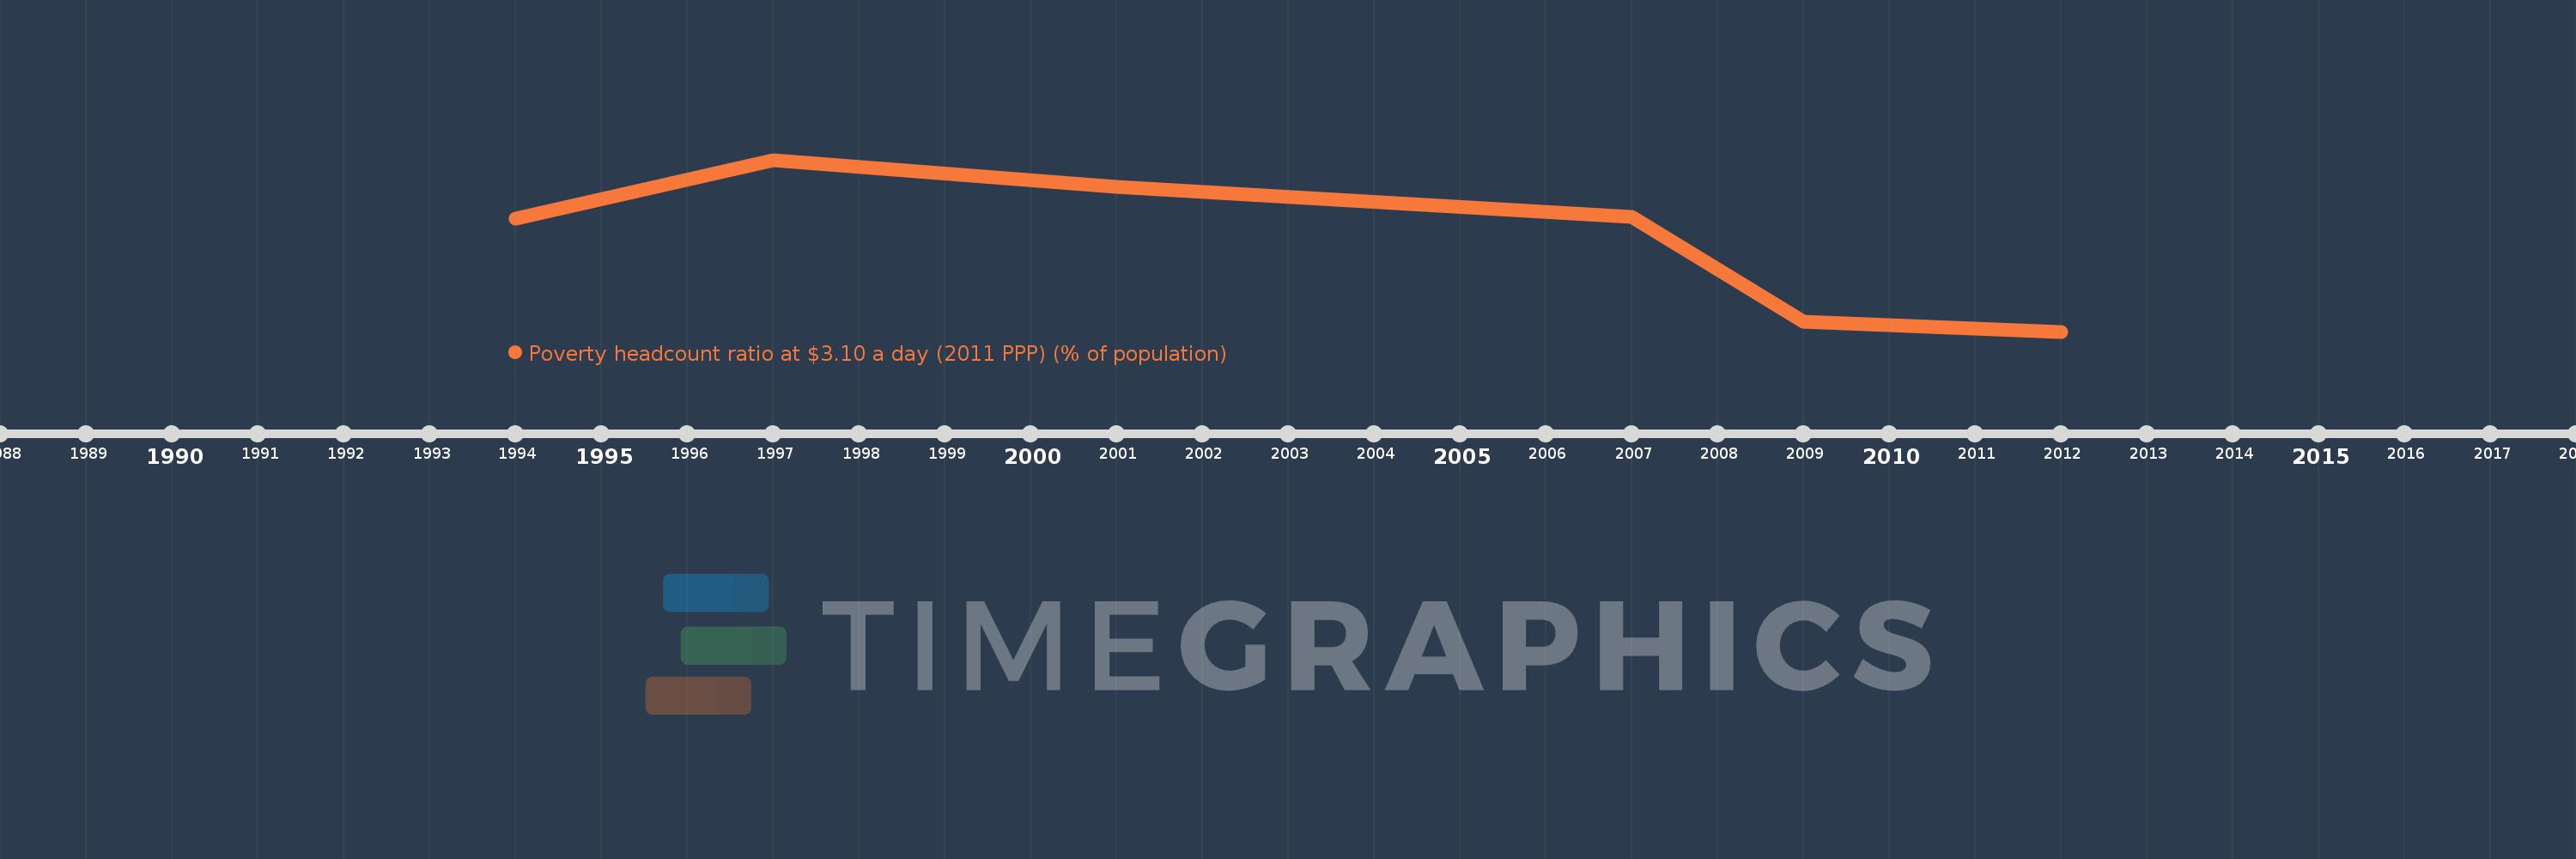
En esta escala de tiempo se presenta un gráfico de 1994 y 2012 de South Africa. Los datos de 1993 están ausentes. El número de observaciones reales por fecha: 6.
Fuente (nombre):
Indicadores del desarrollo mundial
Fuente (organización):
World Bank, Development Research Group. Data are based on primary household survey data obtained from government statistical agencies and World Bank country departments. Data for high-income economies are from the Luxembourg Income Study database. For more information and methodology, please see PovcalNet (http://iresearch.worldbank.org/PovcalNet/index.htm).
Categorías:
Poverty
Se ha actualizado:
23 abr 2017 año
Los indicadores de los cambios de valor en los últimos años
Mínimo:
34.68
1 ene 2012 año
Máximo:
52.86
1 ene 1997 año
A la fecha de observación
Valor
Cambio absoluto
El cambio con respecto al valor anterior
1 ene 1994 año
46.67
+46.67
0.0%
1 ene 1997 año
52.86
+6.19
13.26%
1 ene 2001 año
49.97
-2.89
-5.47%
1 ene 2007 año
46.84
-3.13
-6.26%
1 ene 2009 año
35.75
-11.09
-23.68%
1 ene 2012 año
34.68
-1.07
-2.99%
Ranking de los países por los datos estadísticos actuales