29
/es/
es
AIzaSyAYiBZKx7MnpbEhh9jyipgxe19OcubqV5w
April 1, 2024
24273
Arab World
ARB
false
2
1
Manufacturing, value added (constant 2010 US$)
2016,2015,2014,2013,2012,2011,2010,2009,2008,2007,2006,2005,2004,2003,2002,2001,2000,1999,1998,1997,1996,1995
Download
Estadísticas Globales de la Biblioteca →Arab World →

Manufacturing, value added (constant 2010 US$)

Estas estadísticas en otros países:
AfghanistanAlbaniaAndorraAntigua and BarbudaArab WorldArgentinaArmeniaArubaAustraliaAustriaAzerbaijanBahamas, TheBahrainBangladeshBarbadosBelarusBelgiumBelizeBeninBermudaBhutanBoliviaBosnia and HerzegovinaBotswanaBrazilBrunei DarussalamBurkina FasoBurundiCambodiaCameroonCanadaCaribbean small statesCentral African RepublicCentral Europe and the BalticsChadChileChinaColombiaComorosCongo, Dem. Rep.Congo, Rep.Costa RicaCote d'IvoireCroatiaCubaCyprusCzech RepublicDenmarkDominicaDominican RepublicEarly-demographic dividendEast Asia & PacificEast Asia & Pacific (excluding high income)East Asia & Pacific (IDA & IBRD countries)EcuadorEgypt, Arab Rep.El SalvadorEquatorial GuineaEstoniaEthiopiaEuro areaEurope & Central AsiaEurope & Central Asia (excluding high income)Europe & Central Asia (IDA & IBRD countries)European UnionFaroe IslandsFijiFinlandFragile and conflict affected situationsFranceGabonGambia, TheGeorgiaGermanyGhanaGreeceGrenadaGuatemalaGuineaGuyanaHeavily indebted poor countries (HIPC)High incomeHondurasHong Kong SAR, ChinaHungaryIBRD onlyIcelandIDA & IBRD totalIDA blendIDA onlyIDA totalIndiaIndonesiaIran, Islamic Rep.IraqIrelandItalyJamaicaJapanJordanKazakhstanKenyaKiribatiKorea, Rep.KosovoKuwaitKyrgyz RepublicLao PDRLate-demographic dividendLatin America & Caribbean Latin America & Caribbean (excluding high income)Latin America & the Caribbean (IDA & IBRD countries)LatviaLeast developed countries: UN classificationLebanonLesothoLiberiaLithuaniaLow & middle incomeLow incomeLower middle incomeLuxembourgMacao SAR, ChinaMacedonia, FYRMalawiMalaysiaMaldivesMaltaMarshall IslandsMauritaniaMauritiusMexicoMicronesia, Fed. Sts.Middle East & North AfricaMiddle East & North Africa (excluding high income)Middle East & North Africa (IDA & IBRD countries)Middle incomeMoldovaMongoliaMontenegroMoroccoMozambiqueMyanmarNamibiaNepalNetherlandsNew ZealandNicaraguaNigerNigeriaNorth AmericaNorwayOECD membersOmanOther small statesPacific island small statesPakistanPalauPanamaParaguayPeruPhilippinesPolandPortugalPost-demographic dividendPre-demographic dividendPuerto RicoQatarRomaniaRussian FederationRwandaSamoaSao Tome and PrincipeSaudi ArabiaSenegalSerbiaSeychellesSierra LeoneSingaporeSlovak RepublicSloveniaSmall statesSouth AfricaSouth AsiaSouth Asia (IDA & IBRD)SpainSri LankaSt. Kitts and NevisSt. LuciaSt. Vincent and the GrenadinesSub-Saharan Africa Sub-Saharan Africa (excluding high income)Sub-Saharan Africa (IDA & IBRD countries)SudanSurinameSwazilandSwedenSwitzerlandTajikistanTanzaniaThailandTimor-LesteTogoTongaTrinidad and TobagoTunisiaTurkeyTuvaluUgandaUkraineUnited Arab EmiratesUnited KingdomUnited StatesUpper middle incomeUruguayUzbekistanVanuatuVenezuela, RBVietnamWest Bank and GazaWorldYemen, Rep.ZambiaZimbabwe
línea de tiempo (timeline):
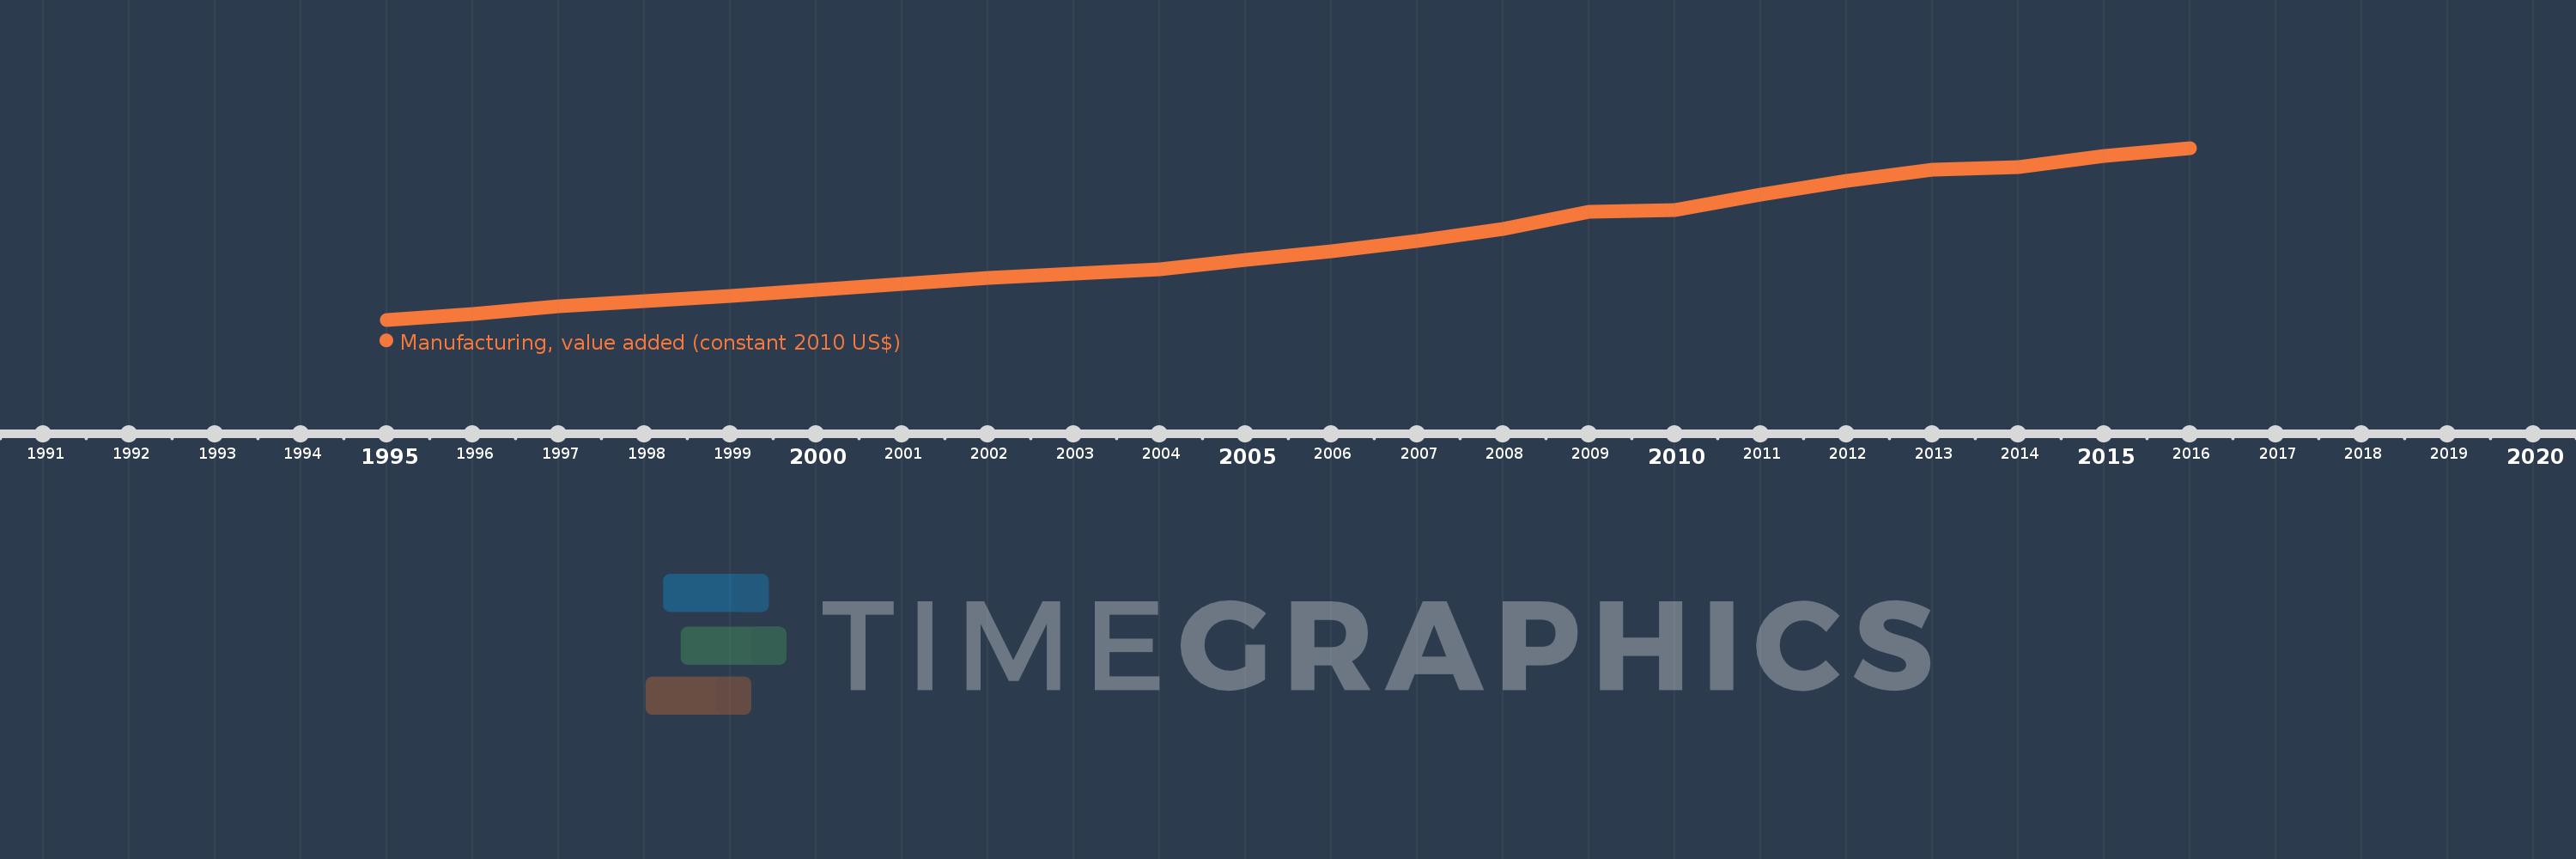
En esta escala de tiempo se presenta un gráfico de 1995 y 2016 de Arab World. Los datos de 1994 están ausentes. El número de observaciones reales por fecha: 22.
Fuente (nombre):
Indicadores del desarrollo mundial
Fuente (organización):
World Bank national accounts data, and OECD National Accounts data files.
Categorías:
Economy & Growth
Se ha actualizado:
23 abr 2017 año
Los indicadores de los cambios de valor en los últimos años
En promedio:
157.576 bn
Mínimo:
83.896 bn
1 ene 1995 año
Máximo:
249.264 bn
1 ene 2016 año
A la fecha de observación
Valor
Cambio absoluto
El cambio con respecto al valor anterior
1 ene 1995 año
83.896 bn
+83.896 bn
0.0%
1 ene 1996 año
89.316 bn
+5.419 bn
6.46%
1 ene 1997 año
96.797 bn
+7.481 bn
8.38%
1 ene 1998 año
102.234 bn
+5.437 bn
5.62%
1 ene 1999 año
106.835 bn
+4.601 bn
4.5%
1 ene 2000 año
112.965 bn
+6.13 bn
5.74%
1 ene 2001 año
118.248 bn
+5.283 bn
4.68%
1 ene 2002 año
123.837 bn
+5.589 bn
4.73%
1 ene 2003 año
128.405 bn
+4.568 bn
3.69%
1 ene 2004 año
132.654 bn
+4.249 bn
3.31%
1 ene 2005 año
141.446 bn
+8.792 bn
6.63%
1 ene 2006 año
149.978 bn
+8.533 bn
6.03%
1 ene 2007 año
159.952 bn
+9.974 bn
6.65%
1 ene 2008 año
171.614 bn
+11.661 bn
7.29%
1 ene 2009 año
188.11 bn
+16.497 bn
9.61%
1 ene 2010 año
189.116 bn
+1.005 bn
0.53%
1 ene 2011 año
204.137 bn
+15.022 bn
7.94%
1 ene 2012 año
217.396 bn
+13.259 bn
6.5%
1 ene 2013 año
228.092 bn
+10.696 bn
4.92%
1 ene 2014 año
230.752 bn
+2.659 bn
1.17%
1 ene 2015 año
241.628 bn
+10.876 bn
4.71%
1 ene 2016 año
249.264 bn
+7.636 bn
3.16%
Ranking de los países por los datos estadísticos actuales

Comentarios:

Enviar
PremiumAbout & FeedbackAcuerdoPrivacidad
logo
© 2022 Selected Technologies LLC – Morgan Hill, California