29
/es/
es
AIzaSyAYiBZKx7MnpbEhh9jyipgxe19OcubqV5w
April 1, 2024
241635
Slovak Republic
SVK
true
2
1
Government expenditure per student, secondary (% of GDP per capita)
2014,2013,2012,2011,2010,2009,2008,2007,2006,2005,2004,2003,2002,2001,2000
Download
Estadísticas Globales de la Biblioteca →Slovak Republic →

Government expenditure per student, secondary (% of GDP per capita)

Estas estadísticas en otros países:
AlbaniaAlgeriaAndorraAntigua and BarbudaArgentinaArmeniaArubaAustraliaAustriaBangladeshBarbadosBelgiumBelizeBeninBermudaBhutanBoliviaBotswanaBrazilBritish Virgin IslandsBrunei DarussalamBulgariaBurkina FasoBurundiCabo VerdeCambodiaCameroonCanadaCaribbean small statesCentral African RepublicCentral Europe and the BalticsChadChileChinaColombiaComorosCongo, Dem. Rep.Congo, Rep.Costa RicaCote d'IvoireCubaCuracaoCyprusCzech RepublicDenmarkDjiboutiDominicaDominican RepublicEast Asia & PacificEcuadorEl SalvadorEritreaEstoniaEthiopiaEuro areaEurope & Central AsiaEuropean UnionFijiFinlandFranceGambia, TheGeorgiaGermanyGhanaGreeceGrenadaGuatemalaGuineaGuyanaHigh incomeHondurasHong Kong SAR, ChinaHungaryIBRD onlyIcelandIndiaIndonesiaIran, Islamic Rep.IrelandIsraelItalyJamaicaJapanJordanKazakhstanKenyaKorea, Rep.KuwaitKyrgyz RepublicLao PDRLate-demographic dividendLatin America & Caribbean Latin America & Caribbean (excluding high income)Latin America & the Caribbean (IDA & IBRD countries)LatviaLebanonLesothoLiechtensteinLithuaniaLuxembourgMacao SAR, ChinaMadagascarMalawiMalaysiaMaliMaltaMarshall IslandsMauritaniaMauritiusMexicoMiddle East & North Africa (excluding high income)Middle East & North Africa (IDA & IBRD countries)MoldovaMonacoMongoliaMoroccoMozambiqueNamibiaNepalNetherlandsNew ZealandNicaraguaNigerNorth AmericaNorwayOECD membersOmanOther small statesPakistanPanamaParaguayPeruPhilippinesPolandPortugalPost-demographic dividendPuerto RicoQatarRomaniaRwandaSamoaSan MarinoSao Tome and PrincipeSaudi ArabiaSenegalSerbiaSeychellesSierra LeoneSingaporeSlovak RepublicSloveniaSmall statesSouth AfricaSouth AsiaSouth Asia (IDA & IBRD)SpainSri LankaSt. LuciaSt. Vincent and the GrenadinesSwazilandSwedenSwitzerlandSyrian Arab RepublicTanzaniaThailandTimor-LesteTogoTongaTunisiaUgandaUkraineUnited Arab EmiratesUnited KingdomUnited StatesUruguayVanuatuVenezuela, RBWorldYemen, Rep.
línea de tiempo (timeline):
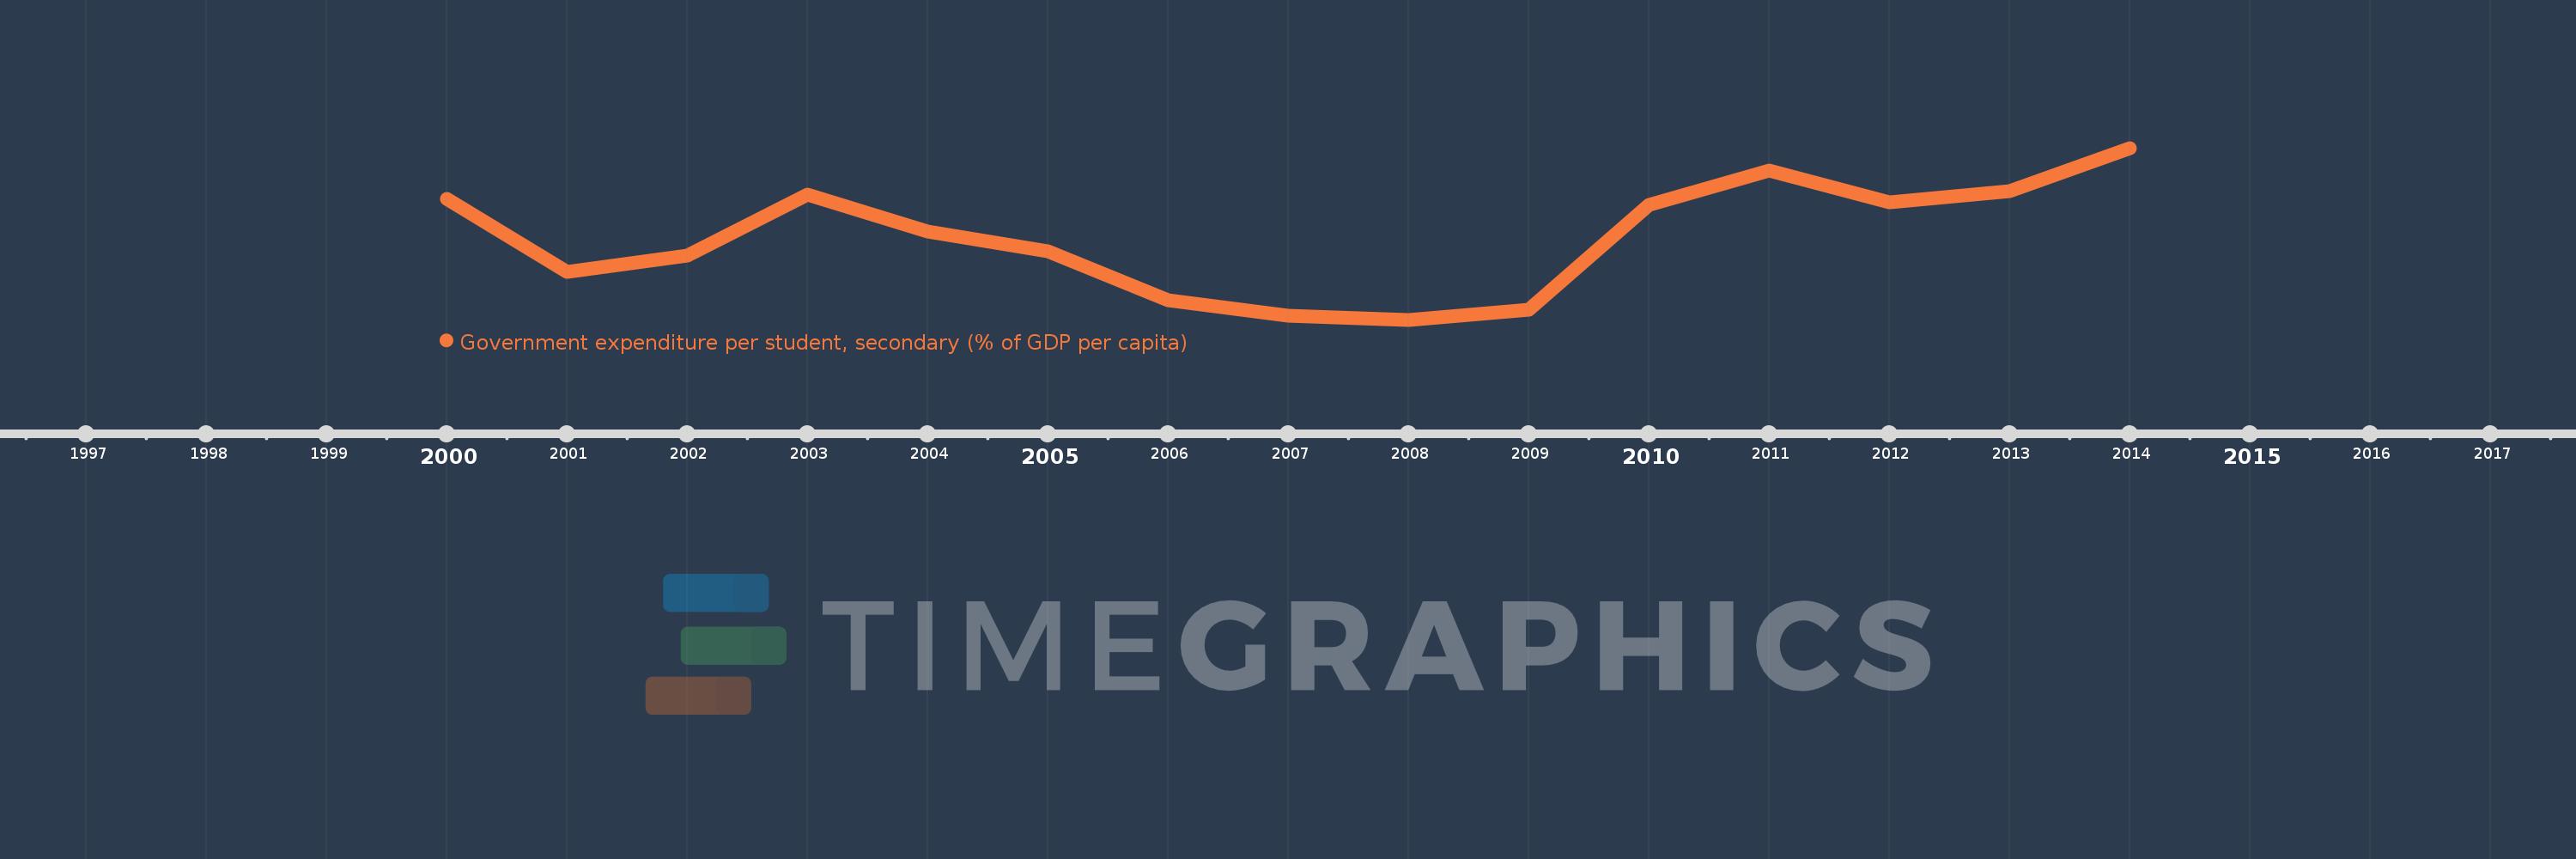
En esta escala de tiempo se presenta un gráfico de 2000 y 2014 de Slovak Republic. Los datos de 1999 están ausentes. El número de observaciones reales por fecha: 15.
Fuente (nombre):
Indicadores del desarrollo mundial
Fuente (organización):
United Nations Educational, Scientific, and Cultural Organization (UNESCO) Institute for Statistics.
Categorías:
Education
Se ha actualizado:
23 abr 2017 año
Los indicadores de los cambios de valor en los últimos años
En promedio:
16.924
Mínimo:
14.373
1 ene 2008 año
Máximo:
19.713
1 ene 2014 año
A la fecha de observación
Valor
Cambio absoluto
El cambio con respecto al valor anterior
1 ene 2000 año
18.141
+18.141
0.0%
1 ene 2001 año
15.851
-2.29
-12.62%
1 ene 2002 año
16.379
+0.528
3.33%
1 ene 2003 año
18.265
+1.886
11.52%
1 ene 2004 año
17.108
-1.156
-6.33%
1 ene 2005 año
16.506
-0.603
-3.52%
1 ene 2006 año
14.977
-1.529
-9.26%
1 ene 2007 año
14.511
-0.466
-3.11%
1 ene 2008 año
14.373
-0.137
-0.95%
1 ene 2009 año
14.694
+0.321
2.23%
1 ene 2010 año
17.947
+3.253
22.14%
1 ene 2011 año
19.0
+1.053
5.87%
1 ene 2012 año
18.03
-0.97
-5.11%
1 ene 2013 año
18.372
+0.342
1.9%
1 ene 2014 año
19.713
+1.341
7.3%
Ranking de los países por los datos estadísticos actuales

Comentarios:

Enviar
PremiumAbout & FeedbackAcuerdoPrivacidad
logo
© 2022 Selected Technologies LLC – Morgan Hill, California