33
/es/
AIzaSyB4mHJ5NPEv-XzF7P6NDYXjlkCWaeKw5bc
November 1, 2025
240373
Singapore
SGP
true
2
1
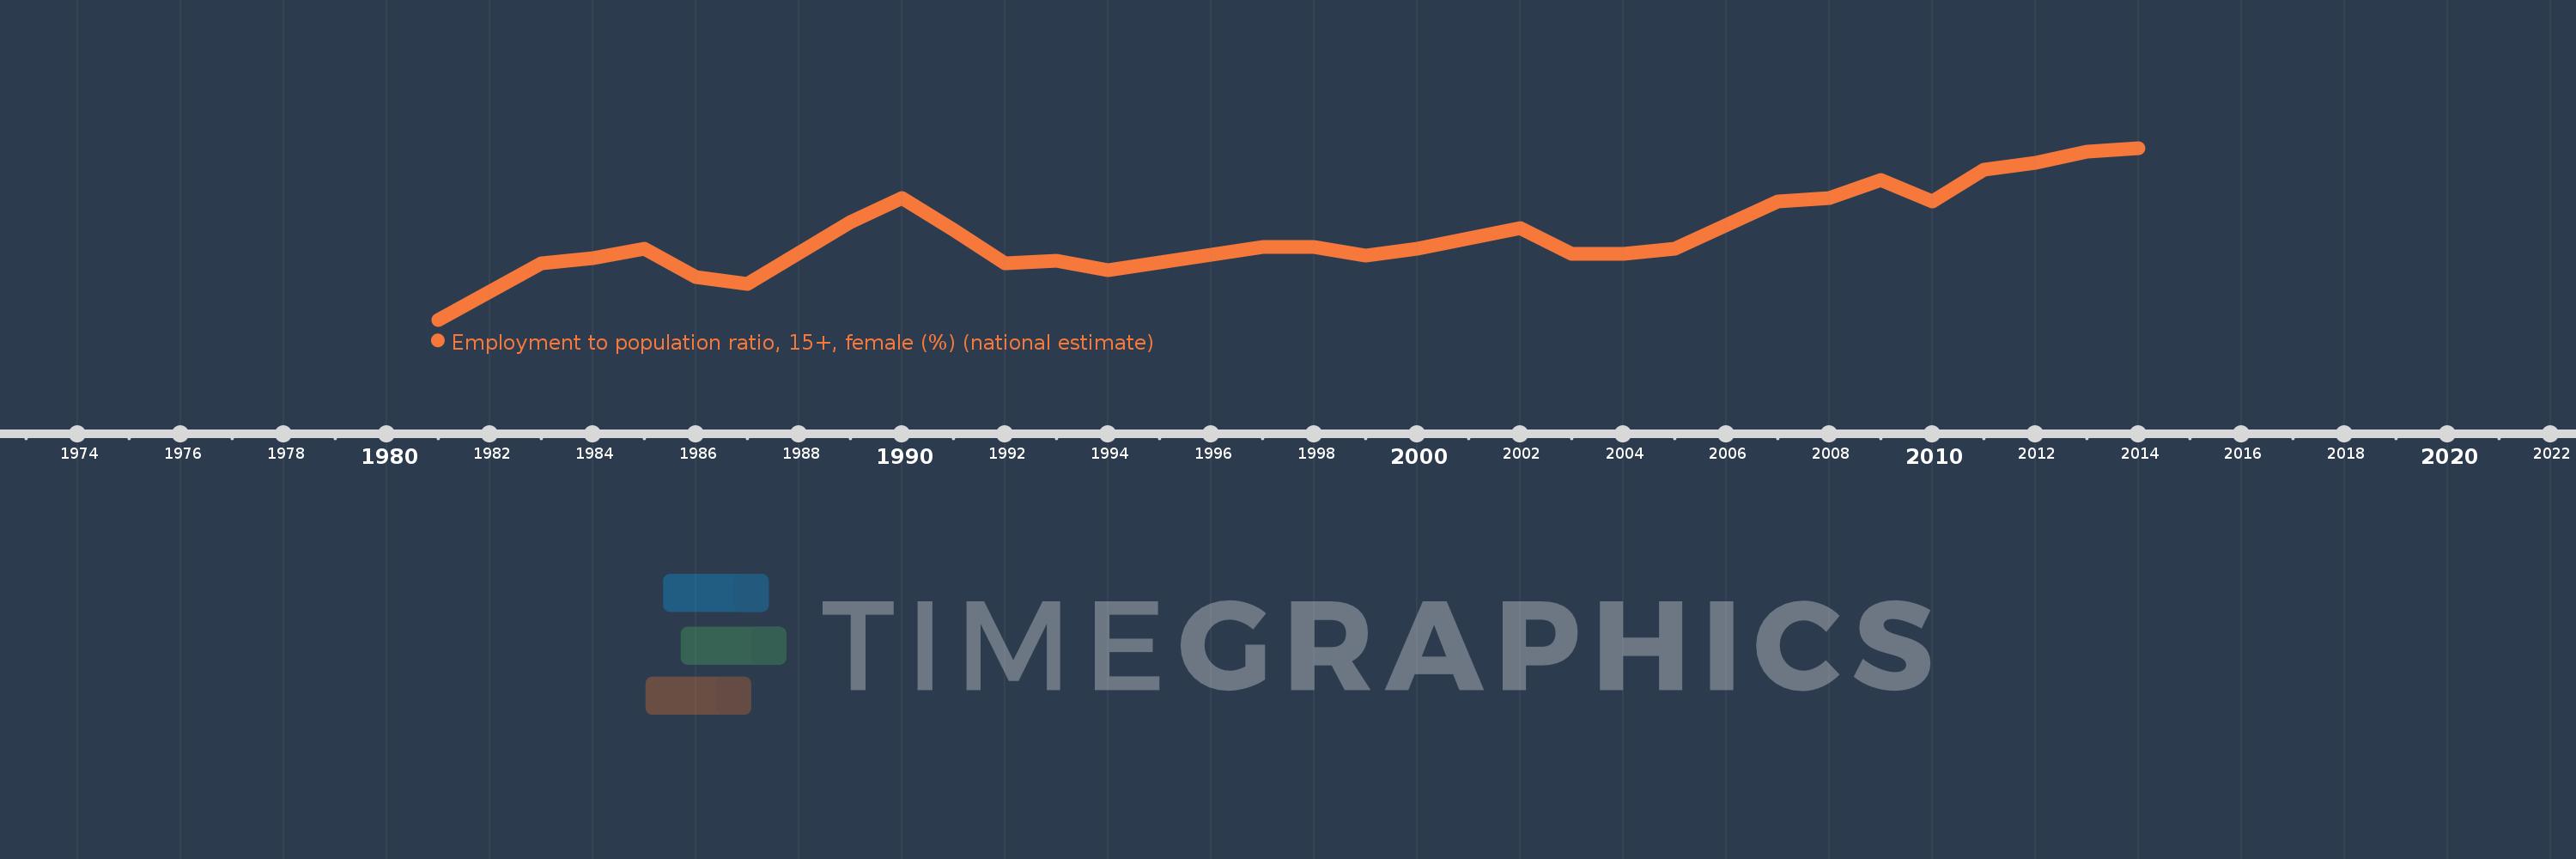
Employment to population ratio, 15+, female (%) (national estimate)
2014,2013,2012,2011,2010,2009,2008,2007,2005,2004,2003,2002,2000,1999,1998,1997,1995,1994,1993,1992,1991,1990,1989,1988,1987,1986,1985,1984,1983,1981