33
/es/
AIzaSyB4mHJ5NPEv-XzF7P6NDYXjlkCWaeKw5bc
November 1, 2025
238624
Seychelles
SYC
true
2
1
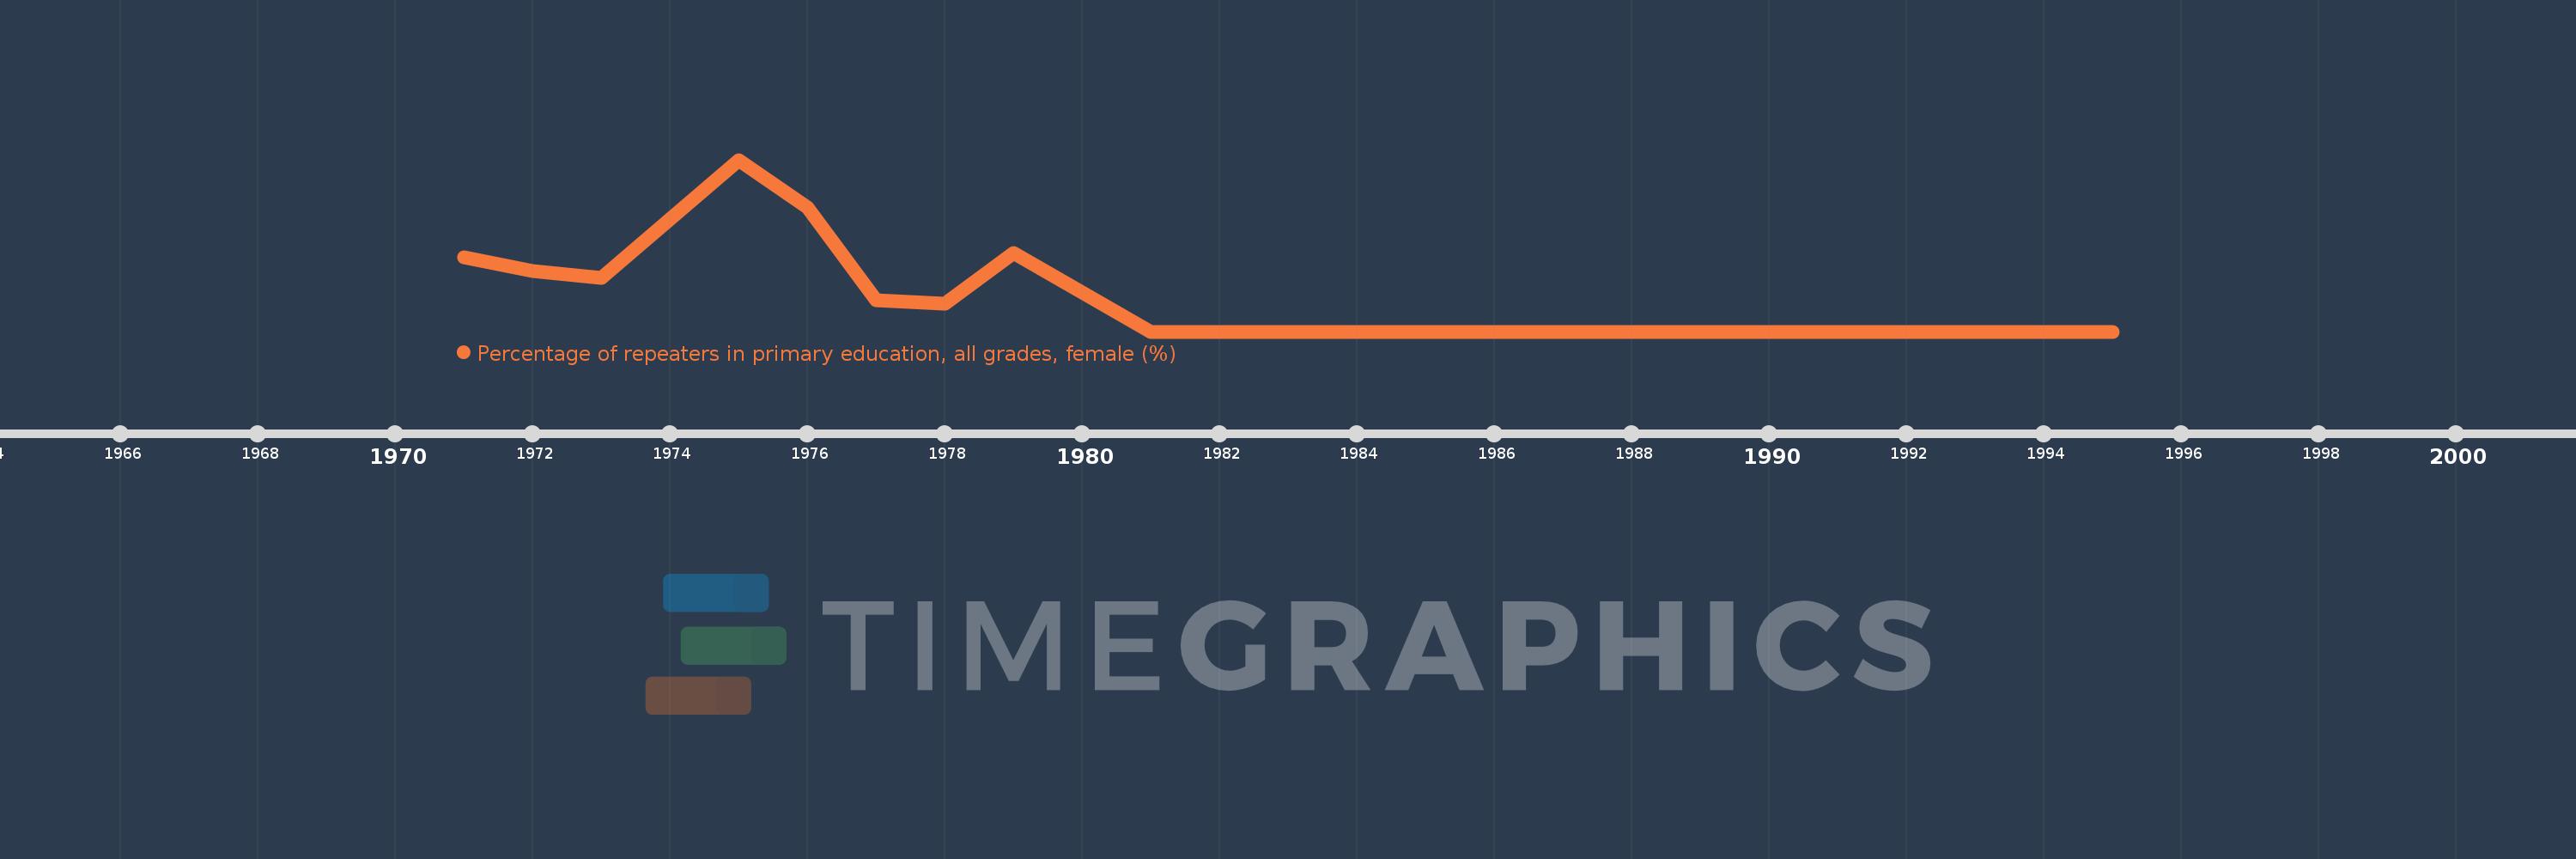
Percentage of repeaters in primary education, all grades, female (%)
1995,1994,1993,1992,1990,1989,1988,1987,1986,1985,1984,1983,1982,1981,1979,1978,1977,1976,1975,1973,1972,1971