33
/es/
AIzaSyAYiBZKx7MnpbEhh9jyipgxe19OcubqV5w
August 1, 2025
237402
Serbia
SRB
true
2
1
Merchandise imports from low- and middle-income economies within region (% of total merchandise imports)
2015,2014,2013,2012,2011,2010,2009,2008,2007,2006
Download
Estadísticas Globales de la Biblioteca →Serbia →

Merchandise imports from low- and middle-income economies within region (% of total merchandise imports)

Estas estadísticas en otros países:

AfghanistanAlbaniaAlgeriaAngolaArab WorldArmeniaAzerbaijanBangladeshBelarusBelizeBeninBoliviaBosnia and HerzegovinaBrazilBulgariaBurkina FasoBurundiCabo VerdeCambodiaCameroonCaribbean small statesCentral African RepublicCentral Europe and the BalticsChadChinaColombiaCongo, Dem. Rep.Congo, Rep.Costa RicaCote d'IvoireCubaDjiboutiDominicaDominican RepublicEarly-demographic dividendEast Asia & PacificEast Asia & Pacific (excluding high income)East Asia & Pacific (IDA & IBRD countries)EcuadorEgypt, Arab Rep.El SalvadorEthiopiaEurope & Central AsiaEurope & Central Asia (excluding high income)Europe & Central Asia (IDA & IBRD countries)European UnionFijiFragile and conflict affected situationsGabonGambia, TheGeorgiaGhanaGrenadaGuatemalaGuineaGuinea-BissauGuyanaHaitiHeavily indebted poor countries (HIPC)HondurasIBRD onlyIDA & IBRD totalIDA blendIDA onlyIDA totalIndiaIndonesiaIran, Islamic Rep.IraqJamaicaJordanKazakhstanKenyaKorea, Dem. People’s Rep.Kyrgyz RepublicLao PDRLate-demographic dividendLatin America & Caribbean Latin America & Caribbean (excluding high income)Latin America & the Caribbean (IDA & IBRD countries)Least developed countries: UN classificationLebanonLiberiaLibyaLow & middle incomeLow incomeLower middle incomeMacedonia, FYRMadagascarMalawiMalaysiaMaldivesMaliMauritaniaMauritiusMexicoMiddle East & North AfricaMiddle East & North Africa (excluding high income)Middle East & North Africa (IDA & IBRD countries)Middle incomeMoldovaMongoliaMontenegroMoroccoMozambiqueMyanmarNepalNicaraguaNigerNigeriaOECD membersOther small statesPacific island small statesPakistanPanamaPapua New GuineaParaguayPeruPhilippinesPost-demographic dividendPre-demographic dividendRomaniaRwandaSamoaSenegalSerbiaSierra LeoneSmall statesSolomon IslandsSomaliaSouth AfricaSouth AsiaSouth Asia (IDA & IBRD)Sri LankaSt. LuciaSt. Vincent and the GrenadinesSub-Saharan Africa Sub-Saharan Africa (excluding high income)Sub-Saharan Africa (IDA & IBRD countries)SudanSurinameSyrian Arab RepublicTajikistanTanzaniaThailandTogoTongaTunisiaTurkeyTurkmenistanUgandaUkraineUpper middle incomeUzbekistanVanuatuVietnamWorldYemen, Rep.ZambiaZimbabwe

línea de tiempo (timeline):

En esta escala de tiempo se presenta un gráfico de 2006 y 2015 de Serbia. Los datos de 2005 están ausentes. El número de observaciones reales por fecha: 10.

Fuente (nombre):

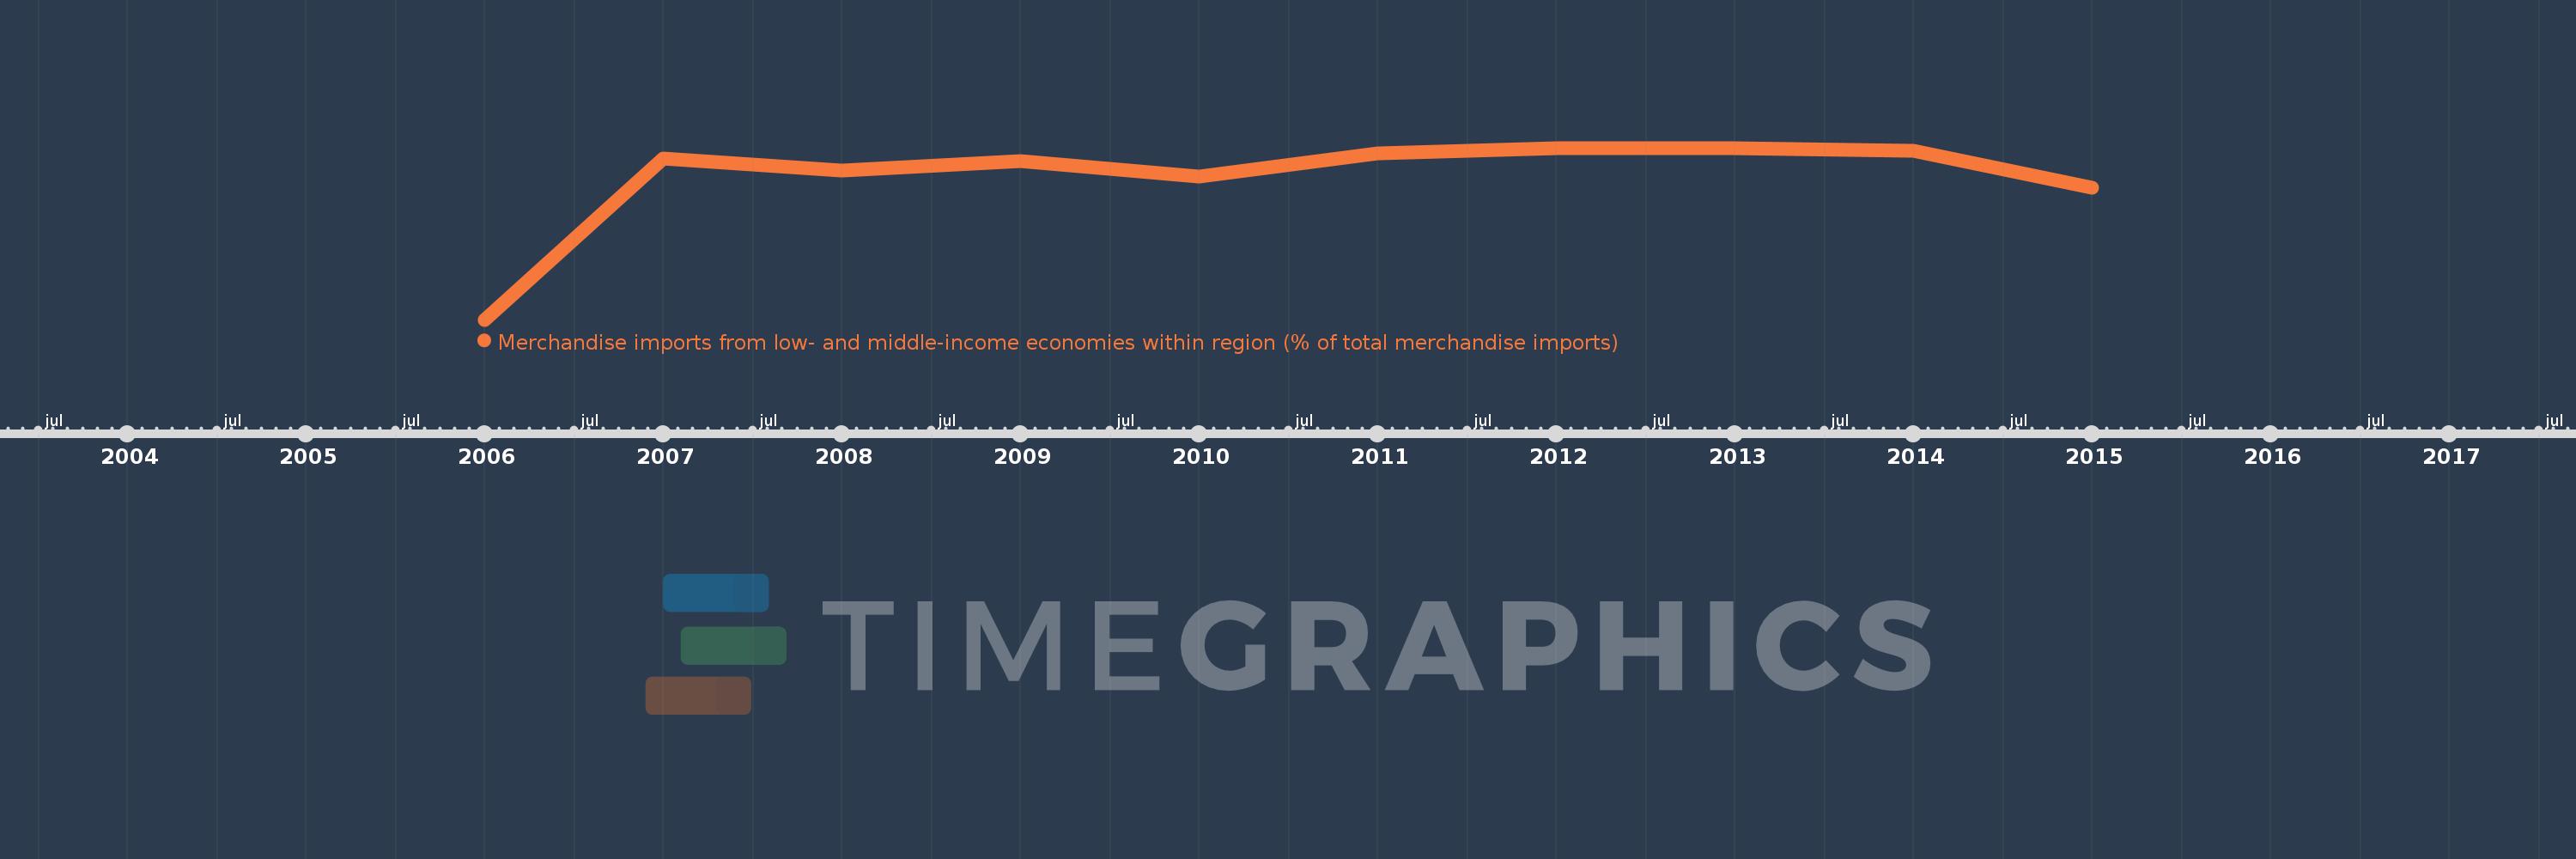
Indicadores del desarrollo mundial

Fuente (organización):

World Bank staff estimates based data from International Monetary Fund's Direction of Trade database.

Categorías:

Private Sector, Trade

Se ha actualizado:

23 abr 2017 año

Los indicadores de los cambios de valor en los últimos años

En promedio:
15.014
Mínimo:
0.0
1 ene 2006 año
Máximo:
18.116
1 ene 2013 año
A la fecha de observación
Valor
Cambio absoluto
El cambio con respecto al valor anterior
1 ene 2006 año
0.0
0.0
0.0%
1 ene 2007 año
17.036
+17.036
%
1 ene 2008 año
15.759
-1.277
-7.5%
1 ene 2009 año
16.709
+0.95
6.03%
1 ene 2010 año
15.101
-1.608
-9.62%
1 ene 2011 año
17.578
+2.477
16.4%
1 ene 2012 año
18.074
+0.496
2.82%
1 ene 2013 año
18.116
+0.041
0.23%
1 ene 2014 año
17.819
-0.297
-1.64%
1 ene 2015 año
13.945
-3.874
-21.74%

Ranking de los países por los datos estadísticos actuales