33
/es/
AIzaSyAYiBZKx7MnpbEhh9jyipgxe19OcubqV5w
August 1, 2025
230424
Russian Federation
RUS
true
2
1
Service exports (BoP, current US$)
2016,2015,2014,2013,2012,2011,2010,2009,2008,2007,2006,2005,2004,2003,2002,2001,2000,1999,1998,1997,1996,1995
Download
Estadísticas Globales de la Biblioteca →Russian Federation →

Service exports (BoP, current US$)

Estas estadísticas en otros países:

AfghanistanAlbaniaAlgeriaAngolaAntigua and BarbudaArab WorldArgentinaArmeniaArubaAustraliaAustriaAzerbaijanBahamas, TheBahrainBangladeshBarbadosBelarusBelgiumBelizeBeninBermudaBhutanBoliviaBosnia and HerzegovinaBotswanaBrazilBrunei DarussalamBulgariaBurkina FasoBurundiCabo VerdeCambodiaCameroonCanadaCaribbean small statesCentral African RepublicCentral Europe and the BalticsChadChileChinaColombiaComorosCongo, Dem. Rep.Congo, Rep.Costa RicaCote d'IvoireCroatiaCuracaoCyprusCzech RepublicDenmarkDjiboutiDominicaDominican RepublicEarly-demographic dividendEast Asia & PacificEast Asia & Pacific (excluding high income)East Asia & Pacific (IDA & IBRD countries)EcuadorEgypt, Arab Rep.El SalvadorEquatorial GuineaEritreaEstoniaEthiopiaEuro areaEurope & Central AsiaEurope & Central Asia (excluding high income)Europe & Central Asia (IDA & IBRD countries)European UnionFaroe IslandsFijiFinlandFragile and conflict affected situationsFranceFrench PolynesiaGabonGambia, TheGeorgiaGermanyGhanaGreeceGrenadaGuatemalaGuineaGuinea-BissauGuyanaHaitiHeavily indebted poor countries (HIPC)High incomeHondurasHong Kong SAR, ChinaHungaryIBRD onlyIcelandIDA & IBRD totalIDA blendIDA onlyIDA totalIndiaIndonesiaIran, Islamic Rep.IraqIrelandIsraelItalyJamaicaJapanJordanKazakhstanKenyaKiribatiKorea, Rep.KosovoKuwaitKyrgyz RepublicLao PDRLate-demographic dividendLatin America & Caribbean Latin America & Caribbean (excluding high income)Latin America & the Caribbean (IDA & IBRD countries)LatviaLeast developed countries: UN classificationLebanonLesothoLiberiaLibyaLithuaniaLow & middle incomeLow incomeLower middle incomeLuxembourgMacao SAR, ChinaMacedonia, FYRMadagascarMalawiMalaysiaMaldivesMaliMaltaMarshall IslandsMauritaniaMauritiusMexicoMicronesia, Fed. Sts.Middle East & North Africa (excluding high income)Middle East & North Africa (IDA & IBRD countries)Middle incomeMoldovaMongoliaMontenegroMoroccoMozambiqueMyanmarNamibiaNepalNetherlandsNew CaledoniaNew ZealandNicaraguaNigerNigeriaNorth AmericaNorwayOECD membersOmanPacific island small statesPakistanPalauPanamaPapua New GuineaParaguayPeruPhilippinesPolandPortugalPost-demographic dividendPre-demographic dividendQatarRomaniaRussian FederationRwandaSamoaSao Tome and PrincipeSaudi ArabiaSenegalSerbiaSeychellesSierra LeoneSingaporeSint Maarten (Dutch part)Slovak RepublicSloveniaSolomon IslandsSouth AfricaSouth AsiaSouth Asia (IDA & IBRD)South SudanSpainSri LankaSt. Kitts and NevisSt. LuciaSt. Vincent and the GrenadinesSub-Saharan Africa Sub-Saharan Africa (excluding high income)Sub-Saharan Africa (IDA & IBRD countries)SudanSurinameSwazilandSwedenSwitzerlandSyrian Arab RepublicTajikistanTanzaniaThailandTimor-LesteTogoTongaTrinidad and TobagoTunisiaTurkeyTuvaluUgandaUkraineUnited KingdomUnited StatesUpper middle incomeUruguayVanuatuVenezuela, RBVietnamWest Bank and GazaWorldYemen, Rep.ZambiaZimbabwe

línea de tiempo (timeline):

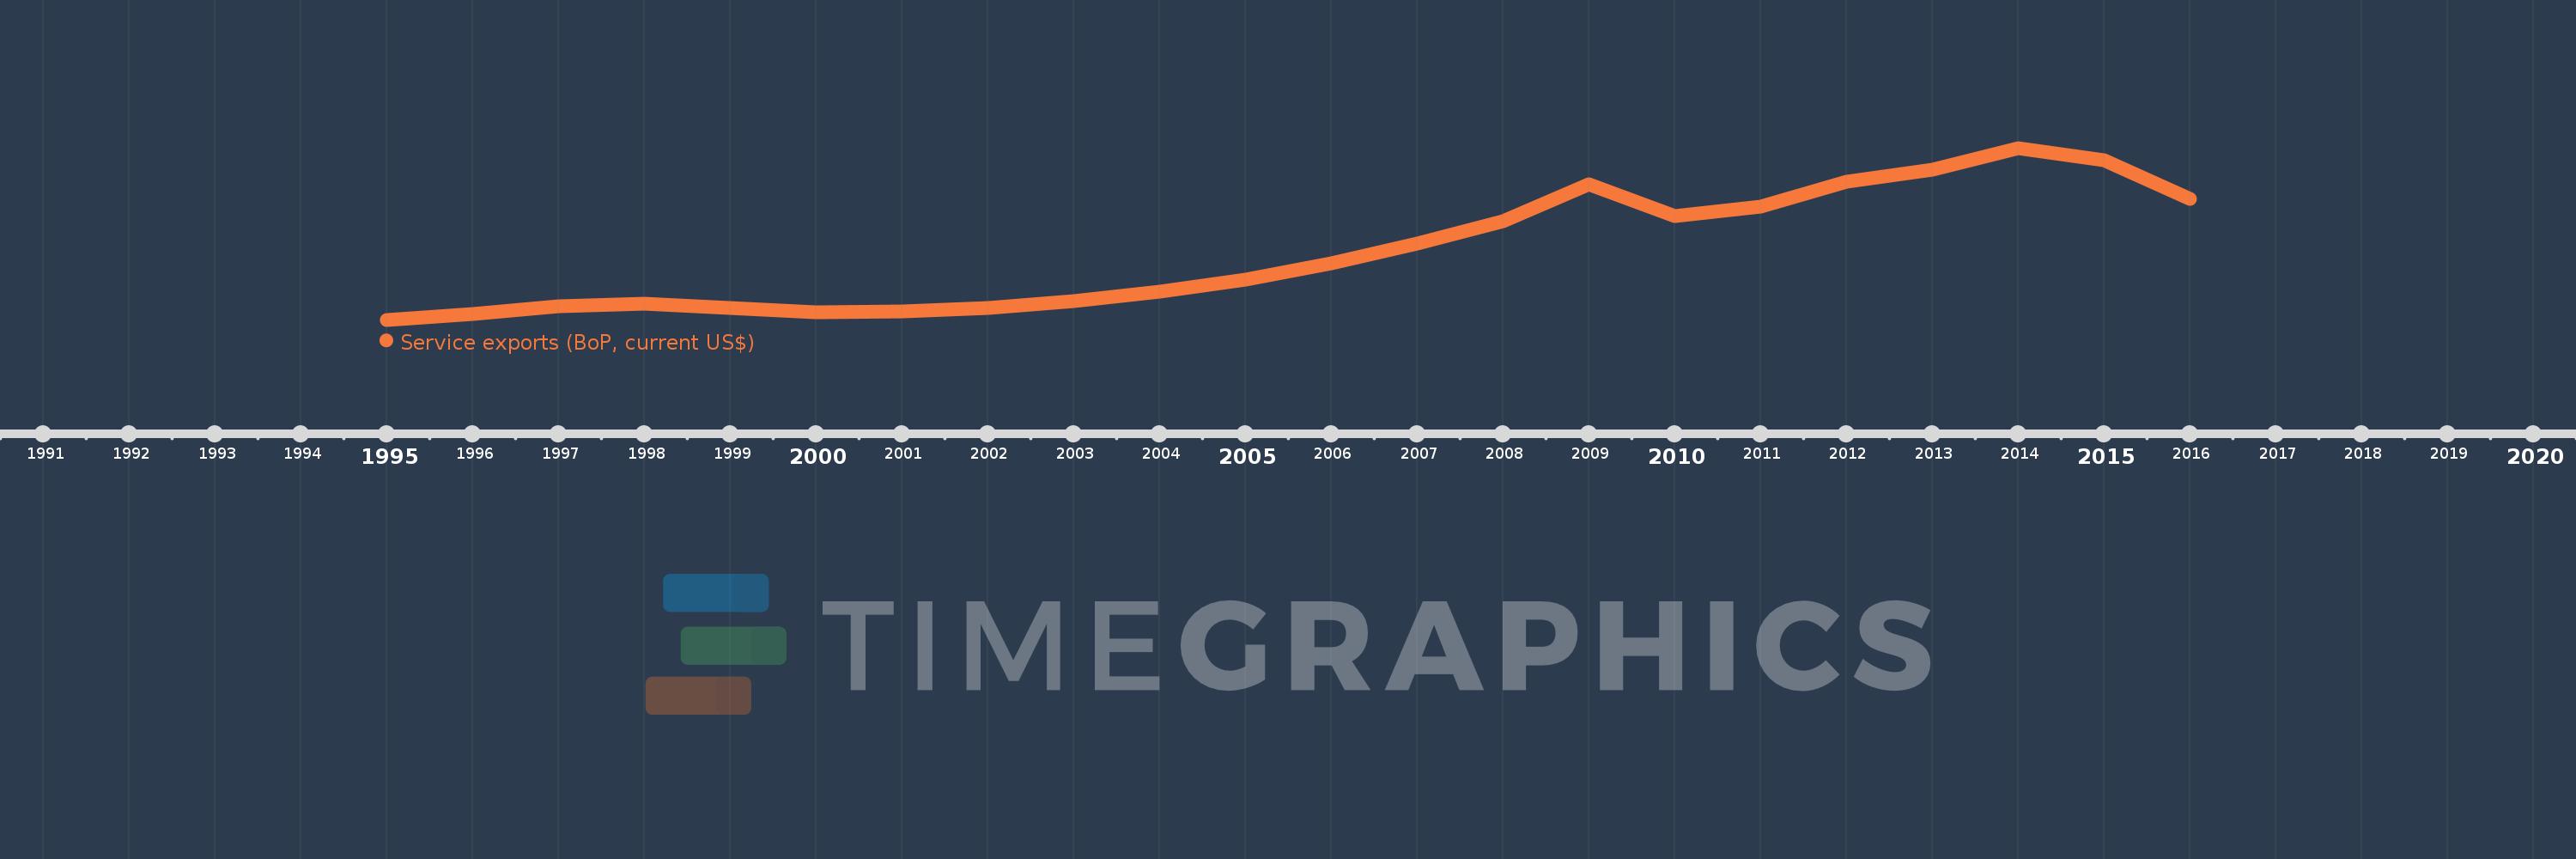
En esta escala de tiempo se presenta un gráfico de 1995 y 2016 de Russian Federation. Los datos de 1994 están ausentes. El número de observaciones reales por fecha: 22.

Fuente (nombre):

Indicadores del desarrollo mundial

Fuente (organización):

International Monetary Fund, Balance of Payments Statistics Yearbook and data files.

Categorías:

Economy & Growth, Trade

Se ha actualizado:

23 abr 2017 año

Los indicadores de los cambios de valor en los últimos años

En promedio:
32.681 bn
Mínimo:
8.424 bn
1 ene 1995 año
Máximo:
70.123 bn
1 ene 2014 año
A la fecha de observación
Valor
Cambio absoluto
El cambio con respecto al valor anterior
1 ene 1995 año
8.424 bn
+8.424 bn
0.0%
1 ene 1996 año
10.567 bn
+2.144 bn
25.45%
1 ene 1997 año
13.281 bn
+2.714 bn
25.68%
1 ene 1998 año
14.08 bn
+798.34 millones
6.01%
1 ene 1999 año
12.505 bn
-1.575 bn
-11.18%
1 ene 2000 año
11.095 bn
-1.41 bn
-11.28%
1 ene 2001 año
11.3 bn
+205.42 millones
1.85%
1 ene 2002 año
12.72 bn
+1.42 bn
12.56%
1 ene 2003 año
15.117 bn
+2.397 bn
18.84%
1 ene 2004 año
18.425 bn
+3.308 bn
21.89%
1 ene 2005 año
22.969 bn
+4.544 bn
24.66%
1 ene 2006 año
28.845 bn
+5.876 bn
25.58%
1 ene 2007 año
35.719 bn
+6.873 bn
23.83%
1 ene 2008 año
43.86 bn
+8.142 bn
22.79%
1 ene 2009 año
57.136 bn
+13.276 bn
30.27%
1 ene 2010 año
45.797 bn
-11.339 bn
-19.85%
1 ene 2011 año
49.159 bn
+3.362 bn
7.34%
1 ene 2012 año
58.039 bn
+8.88 bn
18.06%
1 ene 2013 año
62.34 bn
+4.301 bn
7.41%
1 ene 2014 año
70.123 bn
+7.782 bn
12.48%
1 ene 2015 año
65.744 bn
-4.378 bn
-6.24%
1 ene 2016 año
51.742 bn
-14.002 bn
-21.3%

Ranking de los países por los datos estadísticos actuales