33
/es/
AIzaSyB4mHJ5NPEv-XzF7P6NDYXjlkCWaeKw5bc
November 1, 2025
230205
Russian Federation
RUS
true
2
1
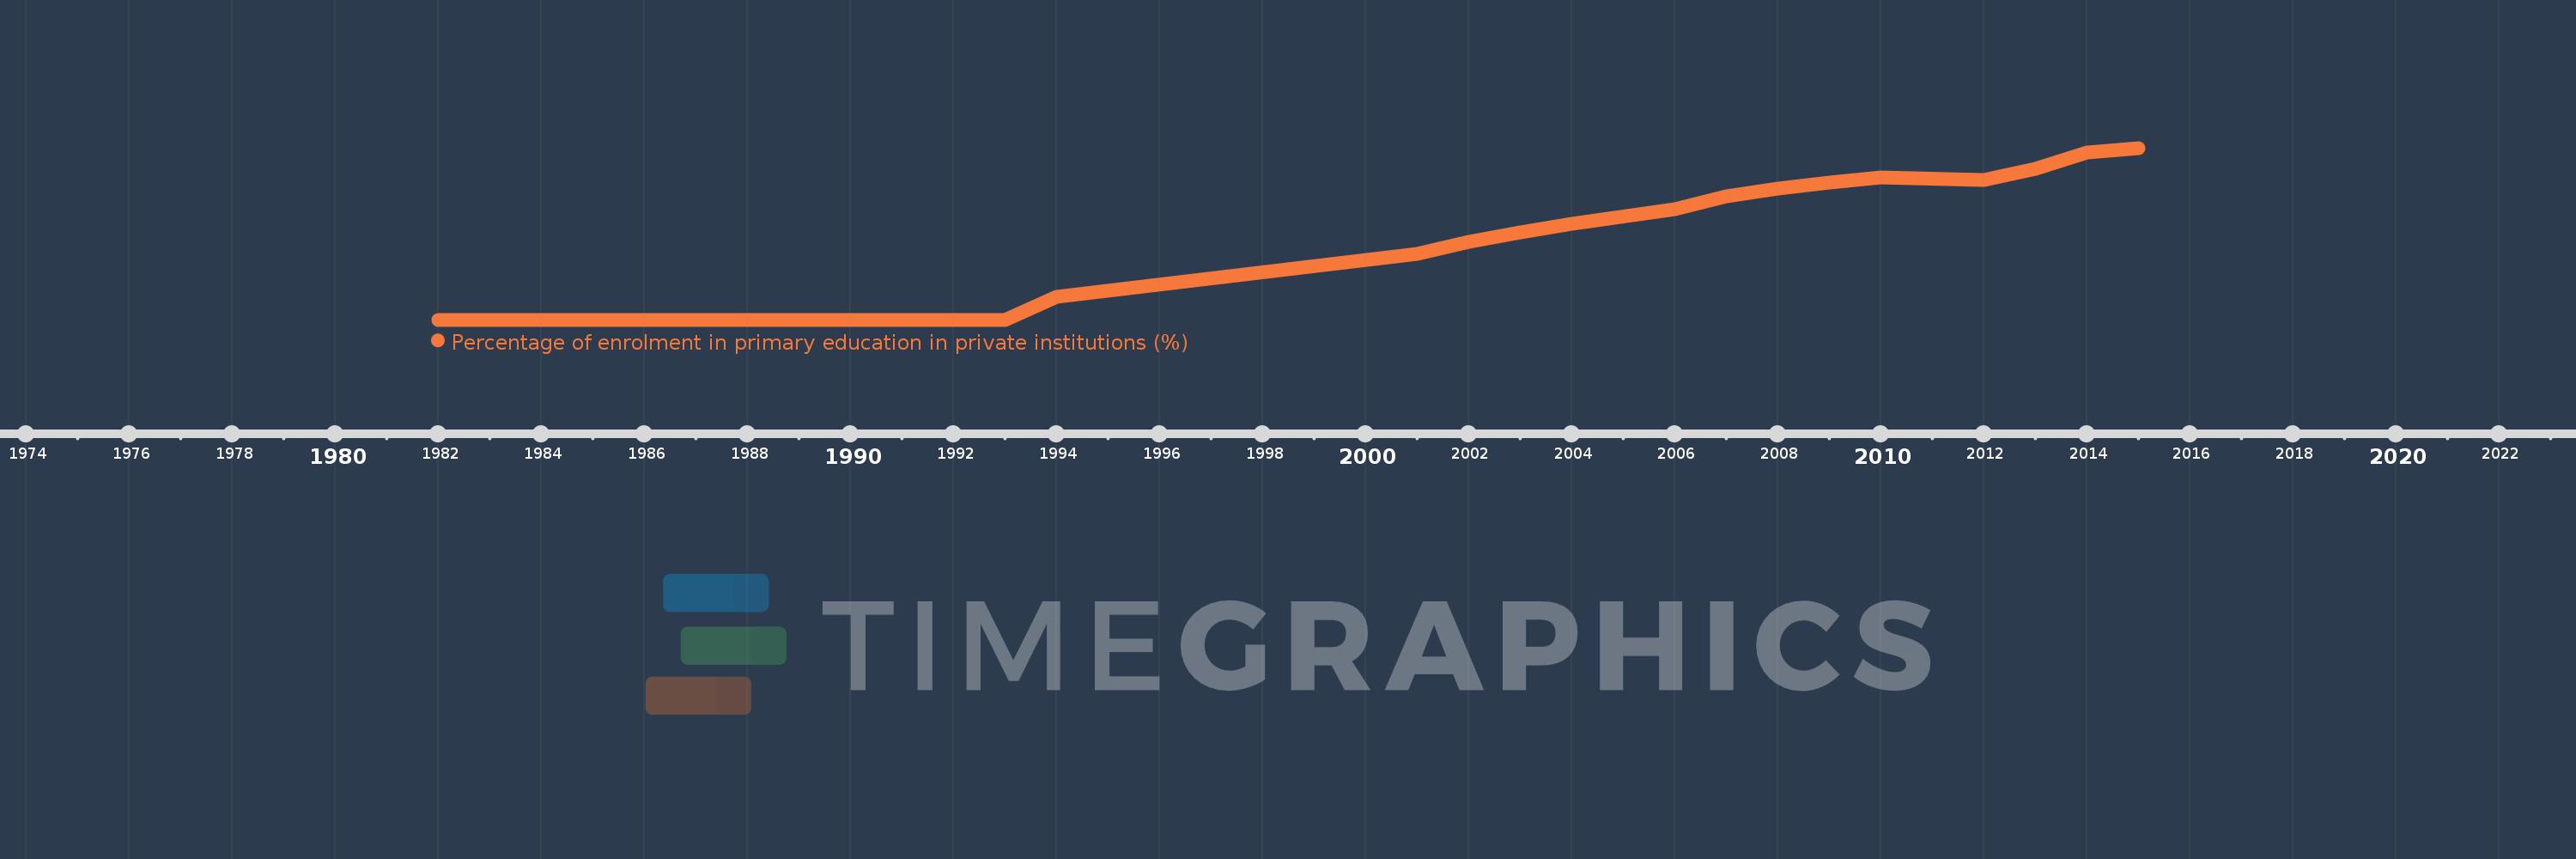
Percentage of enrolment in primary education in private institutions (%)
2015,2014,2013,2012,2010,2009,2008,2007,2006,2004,2003,2002,2001,1994,1993,1992,1991,1990,1989,1988,1987,1986,1985,1984,1983,1982