33
/es/
AIzaSyAYiBZKx7MnpbEhh9jyipgxe19OcubqV5w
August 1, 2025
227707
Qatar
QAT
true
2
1
Net ODA received (% of GNI)
1996,1995,1994,1993,1992,1991,1990,1989,1988,1987,1986,1985,1984,1983,1982,1981,1980,1979,1978,1977,1976,1975,1974,1973,1972,1971
Download
Estadísticas Globales de la Biblioteca →Qatar →

Net ODA received (% of GNI)

Estas estadísticas en otros países:

AfghanistanAlbaniaAlgeriaAngolaAntigua and BarbudaArab WorldArgentinaArmeniaAzerbaijanBahamas, TheBahrainBangladeshBarbadosBelarusBelizeBeninBermudaBhutanBoliviaBosnia and HerzegovinaBotswanaBrazilBrunei DarussalamBurkina FasoBurundiCabo VerdeCambodiaCameroonCaribbean small statesCentral African RepublicCentral Europe and the BalticsChadChileChinaColombiaComorosCongo, Dem. Rep.Congo, Rep.Costa RicaCote d'IvoireCroatiaCubaCyprusDjiboutiDominicaDominican RepublicEast Asia & PacificEast Asia & Pacific (excluding high income)East Asia & Pacific (IDA & IBRD countries)EcuadorEgypt, Arab Rep.El SalvadorEquatorial GuineaEritreaEthiopiaEuro areaEurope & Central AsiaEurope & Central Asia (excluding high income)Europe & Central Asia (IDA & IBRD countries)European UnionFijiFragile and conflict affected situationsFrench PolynesiaGabonGambia, TheGeorgiaGhanaGrenadaGuatemalaGuineaGuinea-BissauGuyanaHaitiHeavily indebted poor countries (HIPC)High incomeHondurasHong Kong SAR, ChinaIBRD onlyIDA & IBRD totalIDA blendIDA onlyIDA totalIndiaIndonesiaIran, Islamic Rep.IraqIsraelJamaicaJordanKazakhstanKenyaKiribatiKorea, Rep.KosovoKuwaitKyrgyz RepublicLao PDRLatin America & Caribbean Latin America & Caribbean (excluding high income)Latin America & the Caribbean (IDA & IBRD countries)Least developed countries: UN classificationLebanonLesothoLiberiaLibyaLow & middle incomeLow incomeLower middle incomeMacao SAR, ChinaMacedonia, FYRMadagascarMalawiMalaysiaMaldivesMaliMaltaMarshall IslandsMauritaniaMauritiusMexicoMicronesia, Fed. Sts.Middle East & North AfricaMiddle East & North Africa (excluding high income)Middle East & North Africa (IDA & IBRD countries)Middle incomeMoldovaMongoliaMontenegroMoroccoMozambiqueMyanmarNamibiaNauruNepalNew CaledoniaNicaraguaNigerNigeriaNorth AmericaOECD membersOmanOther small statesPacific island small statesPakistanPalauPanamaPapua New GuineaParaguayPeruPhilippinesQatarRwandaSamoaSao Tome and PrincipeSaudi ArabiaSenegalSerbiaSeychellesSierra LeoneSingaporeSloveniaSmall statesSolomon IslandsSomaliaSouth AfricaSouth AsiaSouth Asia (IDA & IBRD)South SudanSri LankaSt. Kitts and NevisSt. LuciaSt. Vincent and the GrenadinesSub-Saharan Africa Sub-Saharan Africa (excluding high income)Sub-Saharan Africa (IDA & IBRD countries)SudanSurinameSwazilandSyrian Arab RepublicTajikistanTanzaniaThailandTimor-LesteTogoTongaTrinidad and TobagoTunisiaTurkeyTurkmenistanTuvaluUgandaUkraineUpper middle incomeUruguayUzbekistanVanuatuVenezuela, RBVietnamWest Bank and GazaWorldYemen, Rep.ZambiaZimbabwe

línea de tiempo (timeline):

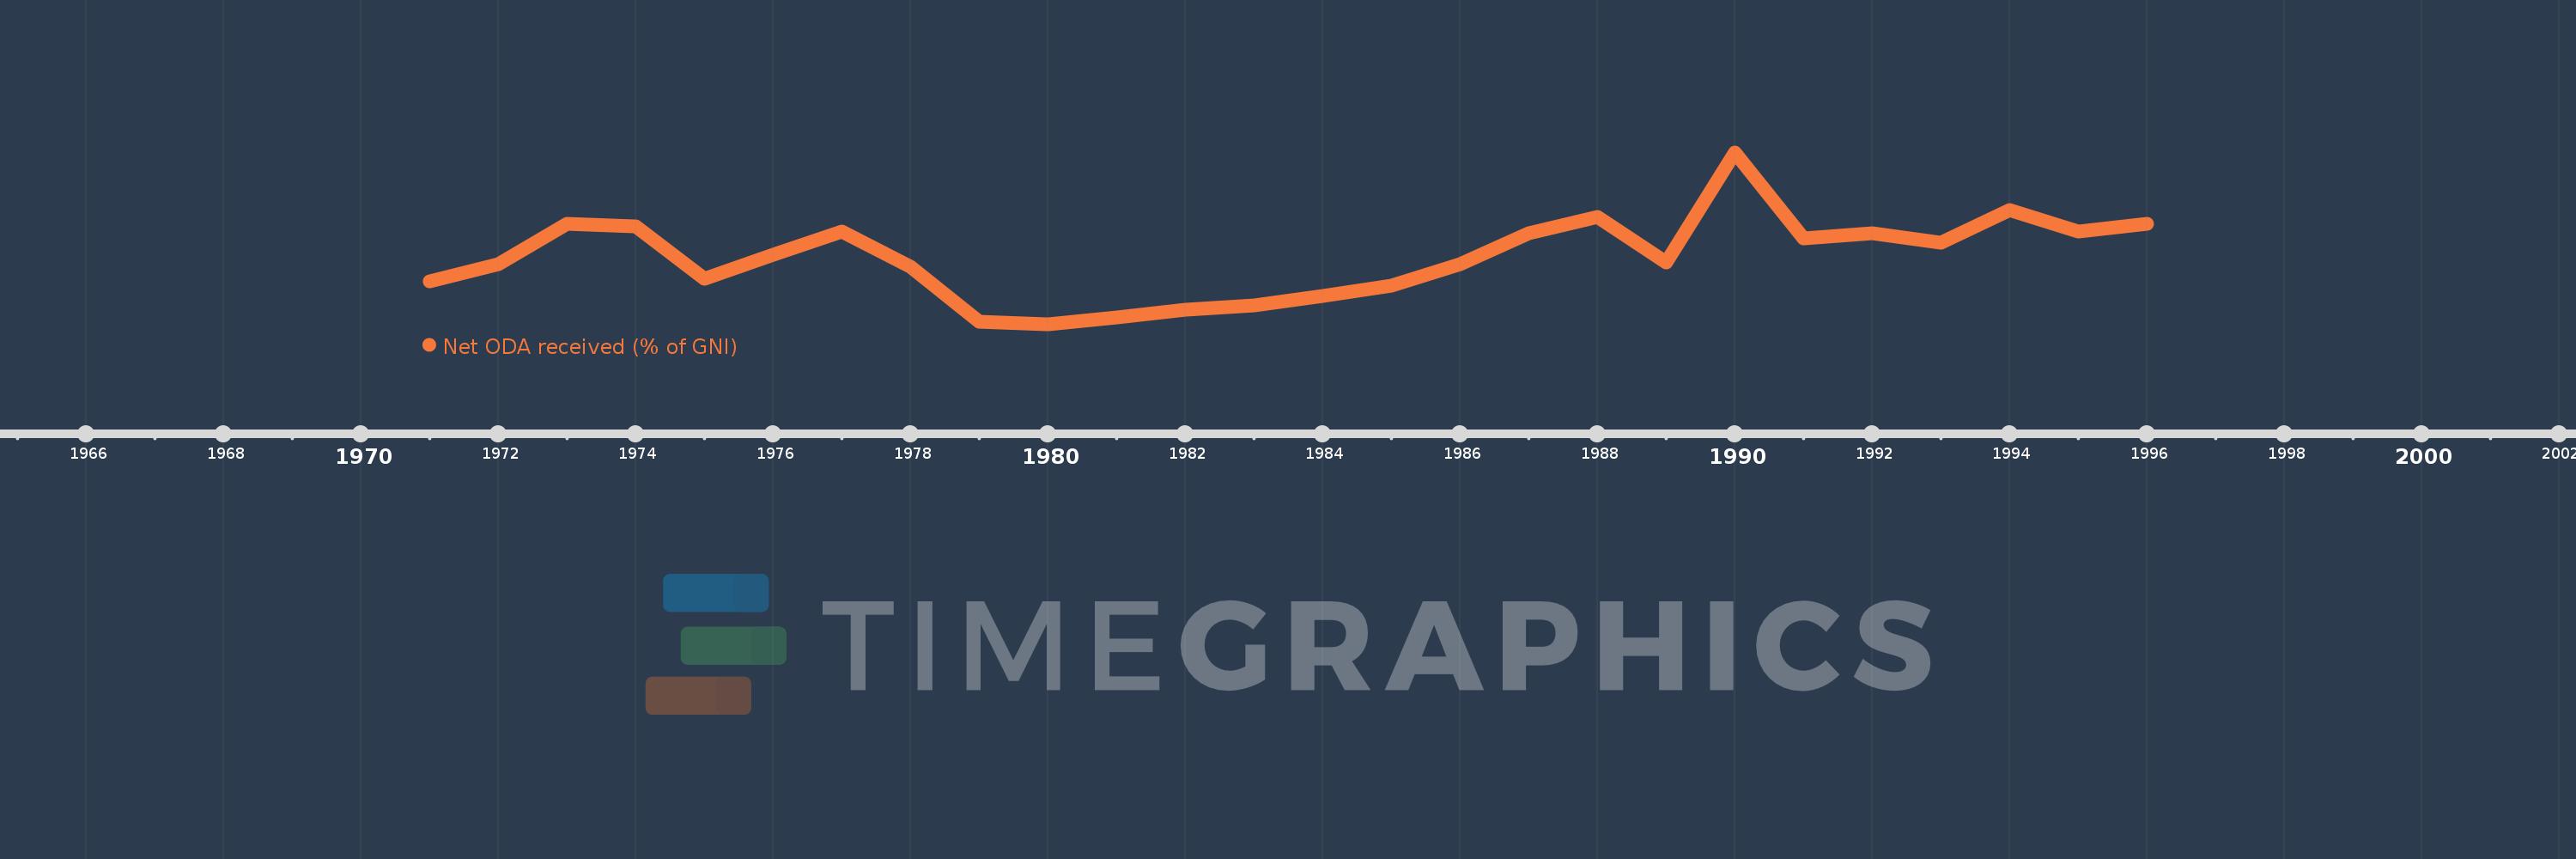
En esta escala de tiempo se presenta un gráfico de 1971 y 1996 de Qatar. Los datos de 1970 están ausentes. El número de observaciones reales por fecha: 26.

Fuente (nombre):

Indicadores del desarrollo mundial

Fuente (organización):

Development Assistance Committee of the Organisation for Economic Co-operation and Development, Geographical Distribution of Financial Flows to Developing Countries, Development Co-operation Report, and International Development Statistics database. Data are available online at: www.oecd.org/dac/stats/idsonline. World Bank GNI estimates are used for the denominator.

Categorías:

Aid Effectiveness, Economy & Growth, External Debt

Se ha actualizado:

23 abr 2017 año

Los indicadores de los cambios de valor en los últimos años

En promedio:
0.031
Mínimo:
0.003
1 ene 1980 año
Máximo:
0.075
1 ene 1990 año
A la fecha de observación
Valor
Cambio absoluto
El cambio con respecto al valor anterior
1 ene 1971 año
0.021
+0.021
0.0%
1 ene 1972 año
0.028
+0.007
34.84%
1 ene 1973 año
0.045
+0.017
59.04%
1 ene 1974 año
0.044
-0.001
-2.63%
1 ene 1975 año
0.022
-0.022
-50.35%
1 ene 1976 año
0.032
+0.01
48.25%
1 ene 1977 año
0.042
+0.01
30.31%
1 ene 1978 año
0.027
-0.015
-36.53%
1 ene 1979 año
0.004
-0.023
-85.47%
1 ene 1980 año
0.003
-0.001
-14.55%
1 ene 1981 año
0.006
+0.003
96.09%
1 ene 1982 año
0.009
+0.003
43.27%
1 ene 1983 año
0.011
+0.001
14.24%
1 ene 1984 año
0.015
+0.005
43.56%
1 ene 1985 año
0.019
+0.004
24.04%
1 ene 1986 año
0.028
+0.009
47.16%
1 ene 1987 año
0.041
+0.014
49.6%
1 ene 1988 año
0.048
+0.006
15.38%
1 ene 1989 año
0.029
-0.019
-39.56%
1 ene 1990 año
0.075
+0.046
158.54%
1 ene 1991 año
0.039
-0.035
-47.51%
1 ene 1992 año
0.041
+0.001
3.79%
1 ene 1993 año
0.037
-0.004
-8.73%
1 ene 1994 año
0.051
+0.014
37.94%
1 ene 1995 año
0.042
-0.009
-17.11%
1 ene 1996 año
0.045
+0.002
5.25%

Ranking de los países por los datos estadísticos actuales