33
/es/
AIzaSyAYiBZKx7MnpbEhh9jyipgxe19OcubqV5w
August 1, 2025
226778
Puerto Rico
PRI
true
2
1
GNI, PPP (constant 2011 international $)
2014,2013,2012,2011,2010,2009,2008,2007,2006,2005,2004,2003,2002,2001,2000,1999,1998,1997,1996,1995,1994,1993,1992,1991
Download
Estadísticas Globales de la Biblioteca →Puerto Rico →

GNI, PPP (constant 2011 international $)

Estas estadísticas en otros países:

AfghanistanAlbaniaAlgeriaAngolaAntigua and BarbudaArab WorldArgentinaArmeniaAustraliaAustriaAzerbaijanBahamas, TheBahrainBangladeshBarbadosBelarusBelgiumBelizeBeninBermudaBhutanBoliviaBosnia and HerzegovinaBotswanaBrazilBrunei DarussalamBulgariaBurkina FasoBurundiCabo VerdeCambodiaCameroonCanadaCaribbean small statesCentral African RepublicCentral Europe and the BalticsChadChileChinaColombiaComorosCongo, Dem. Rep.Congo, Rep.Costa RicaCote d'IvoireCroatiaCubaCyprusCzech RepublicDenmarkDominicaDominican RepublicEarly-demographic dividendEast Asia & PacificEast Asia & Pacific (excluding high income)East Asia & Pacific (IDA & IBRD countries)EcuadorEgypt, Arab Rep.El SalvadorEquatorial GuineaEritreaEstoniaEthiopiaEuro areaEurope & Central AsiaEurope & Central Asia (excluding high income)Europe & Central Asia (IDA & IBRD countries)European UnionFijiFinlandFranceGabonGambia, TheGeorgiaGermanyGhanaGreeceGrenadaGuatemalaGuineaGuinea-BissauGuyanaHaitiHeavily indebted poor countries (HIPC)High incomeHondurasHong Kong SAR, ChinaHungaryIBRD onlyIcelandIDA & IBRD totalIDA blendIDA onlyIDA totalIndiaIndonesiaIran, Islamic Rep.IraqIrelandIsraelItalyJamaicaJapanJordanKazakhstanKenyaKiribatiKorea, Rep.KosovoKuwaitKyrgyz RepublicLao PDRLate-demographic dividendLatin America & Caribbean Latin America & Caribbean (excluding high income)Latin America & the Caribbean (IDA & IBRD countries)LatviaLeast developed countries: UN classificationLebanonLesothoLiberiaLibyaLithuaniaLow & middle incomeLow incomeLower middle incomeLuxembourgMacao SAR, ChinaMacedonia, FYRMadagascarMalawiMalaysiaMaldivesMaliMaltaMarshall IslandsMauritaniaMauritiusMexicoMicronesia, Fed. Sts.Middle East & North AfricaMiddle East & North Africa (excluding high income)Middle East & North Africa (IDA & IBRD countries)Middle incomeMoldovaMongoliaMontenegroMoroccoMozambiqueMyanmarNamibiaNauruNepalNetherlandsNew ZealandNicaraguaNigerNigeriaNorth AmericaNorwayOECD membersOmanOther small statesPakistanPalauPanamaPapua New GuineaParaguayPeruPhilippinesPolandPortugalPost-demographic dividendPre-demographic dividendPuerto RicoQatarRomaniaRussian FederationRwandaSamoaSao Tome and PrincipeSaudi ArabiaSenegalSerbiaSeychellesSierra LeoneSingaporeSlovak RepublicSloveniaSmall statesSolomon IslandsSouth AfricaSouth AsiaSouth Asia (IDA & IBRD)South SudanSpainSri LankaSt. Kitts and NevisSt. LuciaSt. Vincent and the GrenadinesSub-Saharan Africa Sub-Saharan Africa (excluding high income)Sub-Saharan Africa (IDA & IBRD countries)SudanSurinameSwazilandSwedenSwitzerlandTajikistanTanzaniaThailandTimor-LesteTogoTongaTrinidad and TobagoTunisiaTurkeyTurkmenistanTuvaluUgandaUkraineUnited Arab EmiratesUnited KingdomUnited StatesUpper middle incomeUruguayUzbekistanVanuatuVenezuela, RBVietnamWest Bank and GazaWorldYemen, Rep.ZambiaZimbabwe

línea de tiempo (timeline):

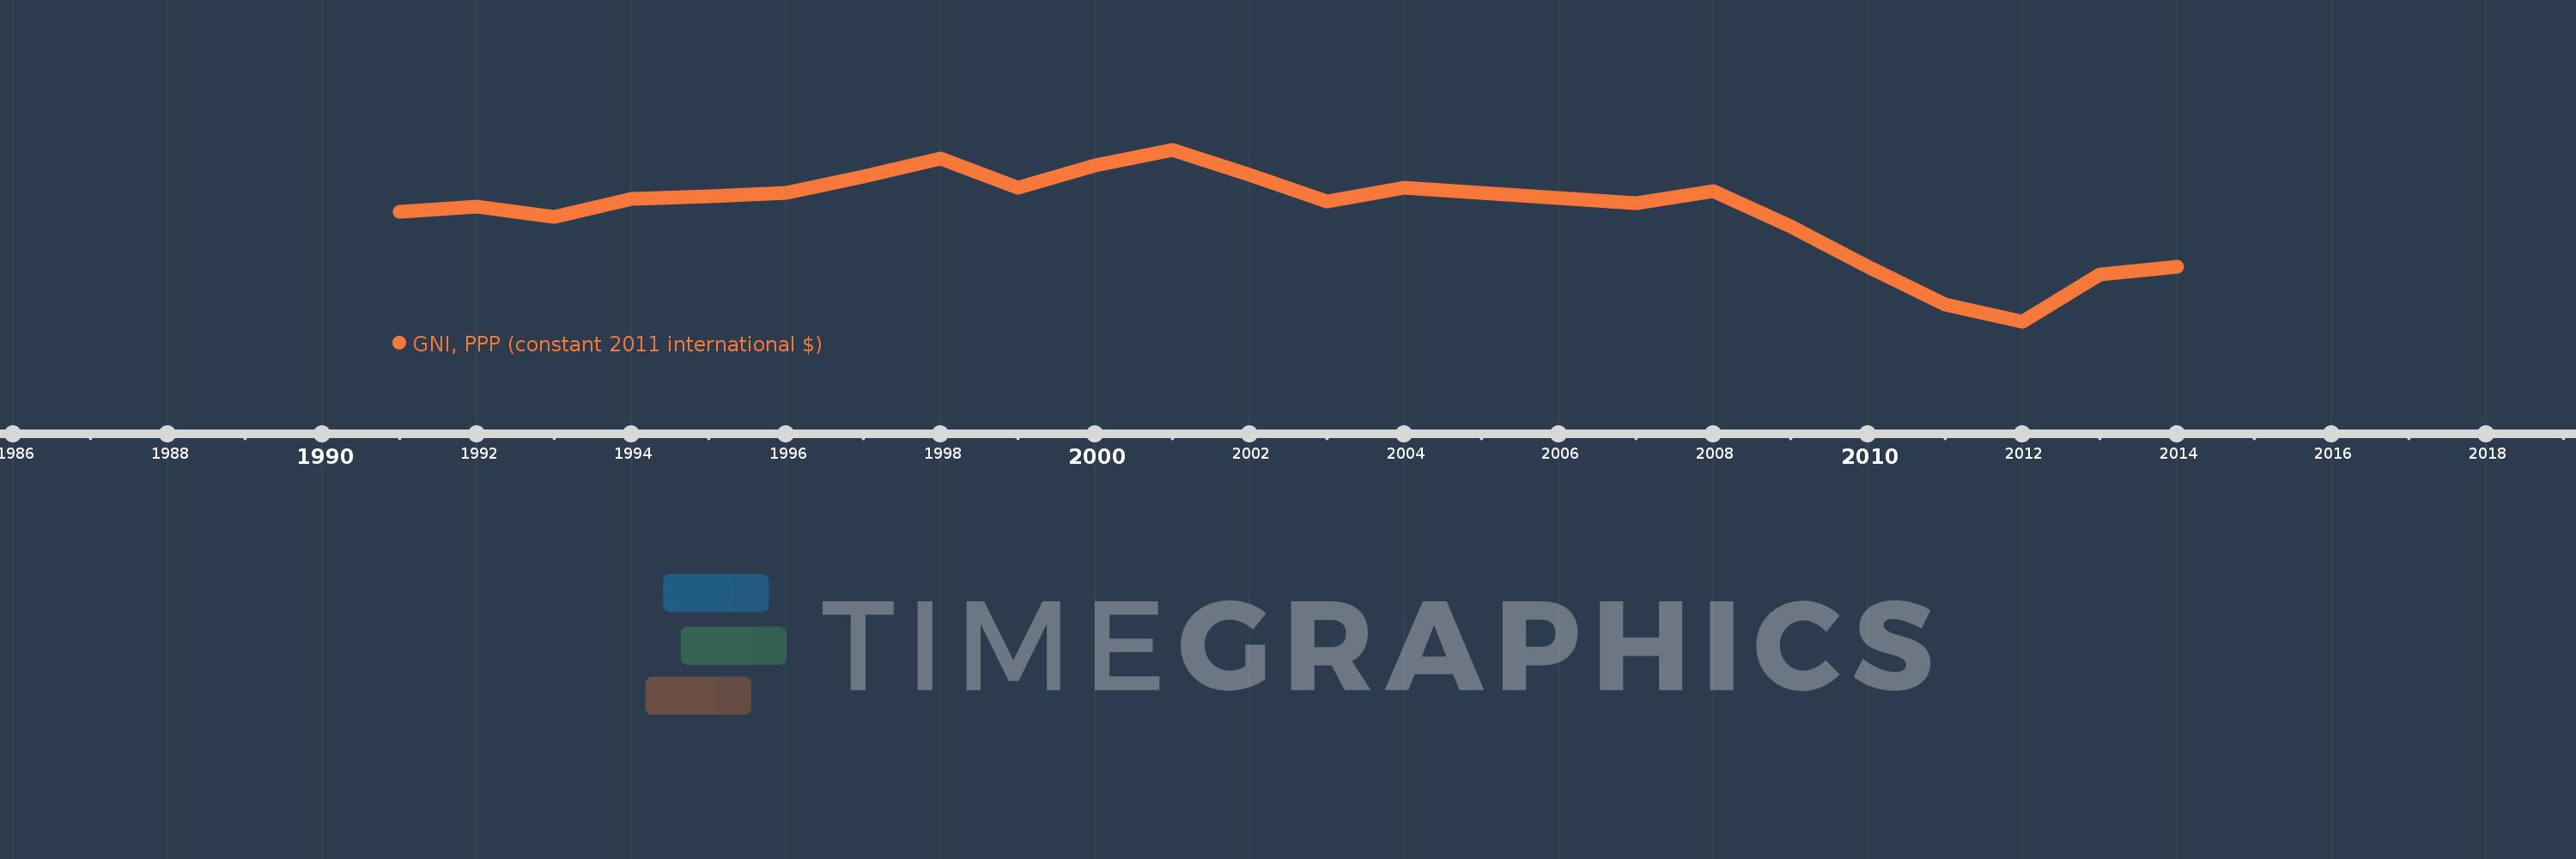
En esta escala de tiempo se presenta un gráfico de 1991 y 2014 de Puerto Rico. Los datos de 1990 están ausentes. El número de observaciones reales por fecha: 24.

Fuente (nombre):

Indicadores del desarrollo mundial

Fuente (organización):

World Bank, International Comparison Program database.

Categorías:

Economy & Growth

Se ha actualizado:

23 abr 2017 año

Los indicadores de los cambios de valor en los últimos años

En promedio:
112.93 bn
Mínimo:
82.385 bn
1 ene 2012 año
Máximo:
129.835 bn
1 ene 2001 año
A la fecha de observación
Valor
Cambio absoluto
El cambio con respecto al valor anterior
1 ene 1991 año
112.766 bn
+112.766 bn
0.0%
1 ene 1992 año
114.203 bn
+1.437 bn
1.27%
1 ene 1993 año
111.486 bn
-2.717 bn
-2.38%
1 ene 1994 año
116.422 bn
+4.935 bn
4.43%
1 ene 1995 año
117.074 bn
+652.202 millones
0.56%
1 ene 1996 año
118.093 bn
+1.019 bn
0.87%
1 ene 1997 año
122.548 bn
+4.455 bn
3.77%
1 ene 1998 año
127.501 bn
+4.953 bn
4.04%
1 ene 1999 año
119.388 bn
-8.112 bn
-6.36%
1 ene 2000 año
125.707 bn
+6.319 bn
5.29%
1 ene 2001 año
129.835 bn
+4.128 bn
3.28%
1 ene 2002 año
123.025 bn
-6.81 bn
-5.25%
1 ene 2003 año
115.583 bn
-7.442 bn
-6.05%
1 ene 2004 año
119.355 bn
+3.772 bn
3.26%
1 ene 2005 año
117.945 bn
-1.41 bn
-1.18%
1 ene 2006 año
116.587 bn
-1.358 bn
-1.15%
1 ene 2007 año
115.211 bn
-1.376 bn
-1.18%
1 ene 2008 año
118.482 bn
+3.271 bn
2.84%
1 ene 2009 año
108.82 bn
-9.662 bn
-8.15%
1 ene 2010 año
97.544 bn
-11.276 bn
-10.36%
1 ene 2011 año
87.123 bn
-10.42 bn
-10.68%
1 ene 2012 año
82.385 bn
-4.739 bn
-5.44%
1 ene 2013 año
95.622 bn
+13.237 bn
16.07%
1 ene 2014 año
97.608 bn
+1.986 bn
2.08%

Ranking de los países por los datos estadísticos actuales