29
/es/
es
AIzaSyAYiBZKx7MnpbEhh9jyipgxe19OcubqV5w
April 1, 2024
224895
Poland
POL
true
2
1
Gross capital formation (current LCU)
2016,2015,2014,2013,2012,2011,2010,2009,2008,2007,2006,2005,2004,2003,2002,2001,2000,1999,1998,1997,1996,1995,1994,1993,1992,1991
Download
Estadísticas Globales de la Biblioteca →Poland →

Gross capital formation (current LCU)

Estas estadísticas en otros países:
AfghanistanAlbaniaAlgeriaAngolaAntigua and BarbudaArgentinaArmeniaArubaAustraliaAustriaAzerbaijanBahamas, TheBahrainBangladeshBarbadosBelarusBelgiumBelizeBeninBermudaBhutanBoliviaBosnia and HerzegovinaBotswanaBrazilBrunei DarussalamBulgariaBurkina FasoBurundiCabo VerdeCambodiaCameroonCanadaCentral African RepublicChadChileChinaColombiaComorosCongo, Dem. Rep.Congo, Rep.Costa RicaCote d'IvoireCroatiaCubaCyprusCzech RepublicDenmarkDjiboutiDominicaDominican RepublicEcuadorEgypt, Arab Rep.El SalvadorEquatorial GuineaEritreaEstoniaEthiopiaFaroe IslandsFijiFinlandFranceGabonGambia, TheGeorgiaGermanyGhanaGreeceGrenadaGuatemalaGuineaGuinea-BissauGuyanaHaitiHondurasHong Kong SAR, ChinaHungaryIcelandIndiaIndonesiaIran, Islamic Rep.IraqIrelandIsraelItalyJamaicaJapanJordanKazakhstanKenyaKiribatiKorea, Rep.KosovoKuwaitKyrgyz RepublicLao PDRLatviaLebanonLesothoLiberiaLibyaLithuaniaLuxembourgMacao SAR, ChinaMacedonia, FYRMadagascarMalawiMalaysiaMaldivesMaliMaltaMauritaniaMauritiusMexicoMicronesia, Fed. Sts.MoldovaMongoliaMontenegroMoroccoMozambiqueNamibiaNepalNetherlandsNew CaledoniaNew ZealandNicaraguaNigerNigeriaNorwayOmanPakistanPanamaPapua New GuineaParaguayPeruPhilippinesPolandPortugalPuerto RicoQatarRomaniaRussian FederationRwandaSaudi ArabiaSenegalSerbiaSeychellesSierra LeoneSingaporeSlovak RepublicSloveniaSolomon IslandsSomaliaSouth AfricaSouth SudanSpainSri LankaSt. Kitts and NevisSt. LuciaSt. Vincent and the GrenadinesSudanSurinameSwazilandSwedenSwitzerlandSyrian Arab RepublicTajikistanTanzaniaThailandTimor-LesteTogoTongaTrinidad and TobagoTunisiaTurkeyTurkmenistanUgandaUkraineUnited Arab EmiratesUnited KingdomUnited StatesUruguayUzbekistanVanuatuVenezuela, RBVietnamWest Bank and GazaYemen, Rep.ZambiaZimbabwe
línea de tiempo (timeline):
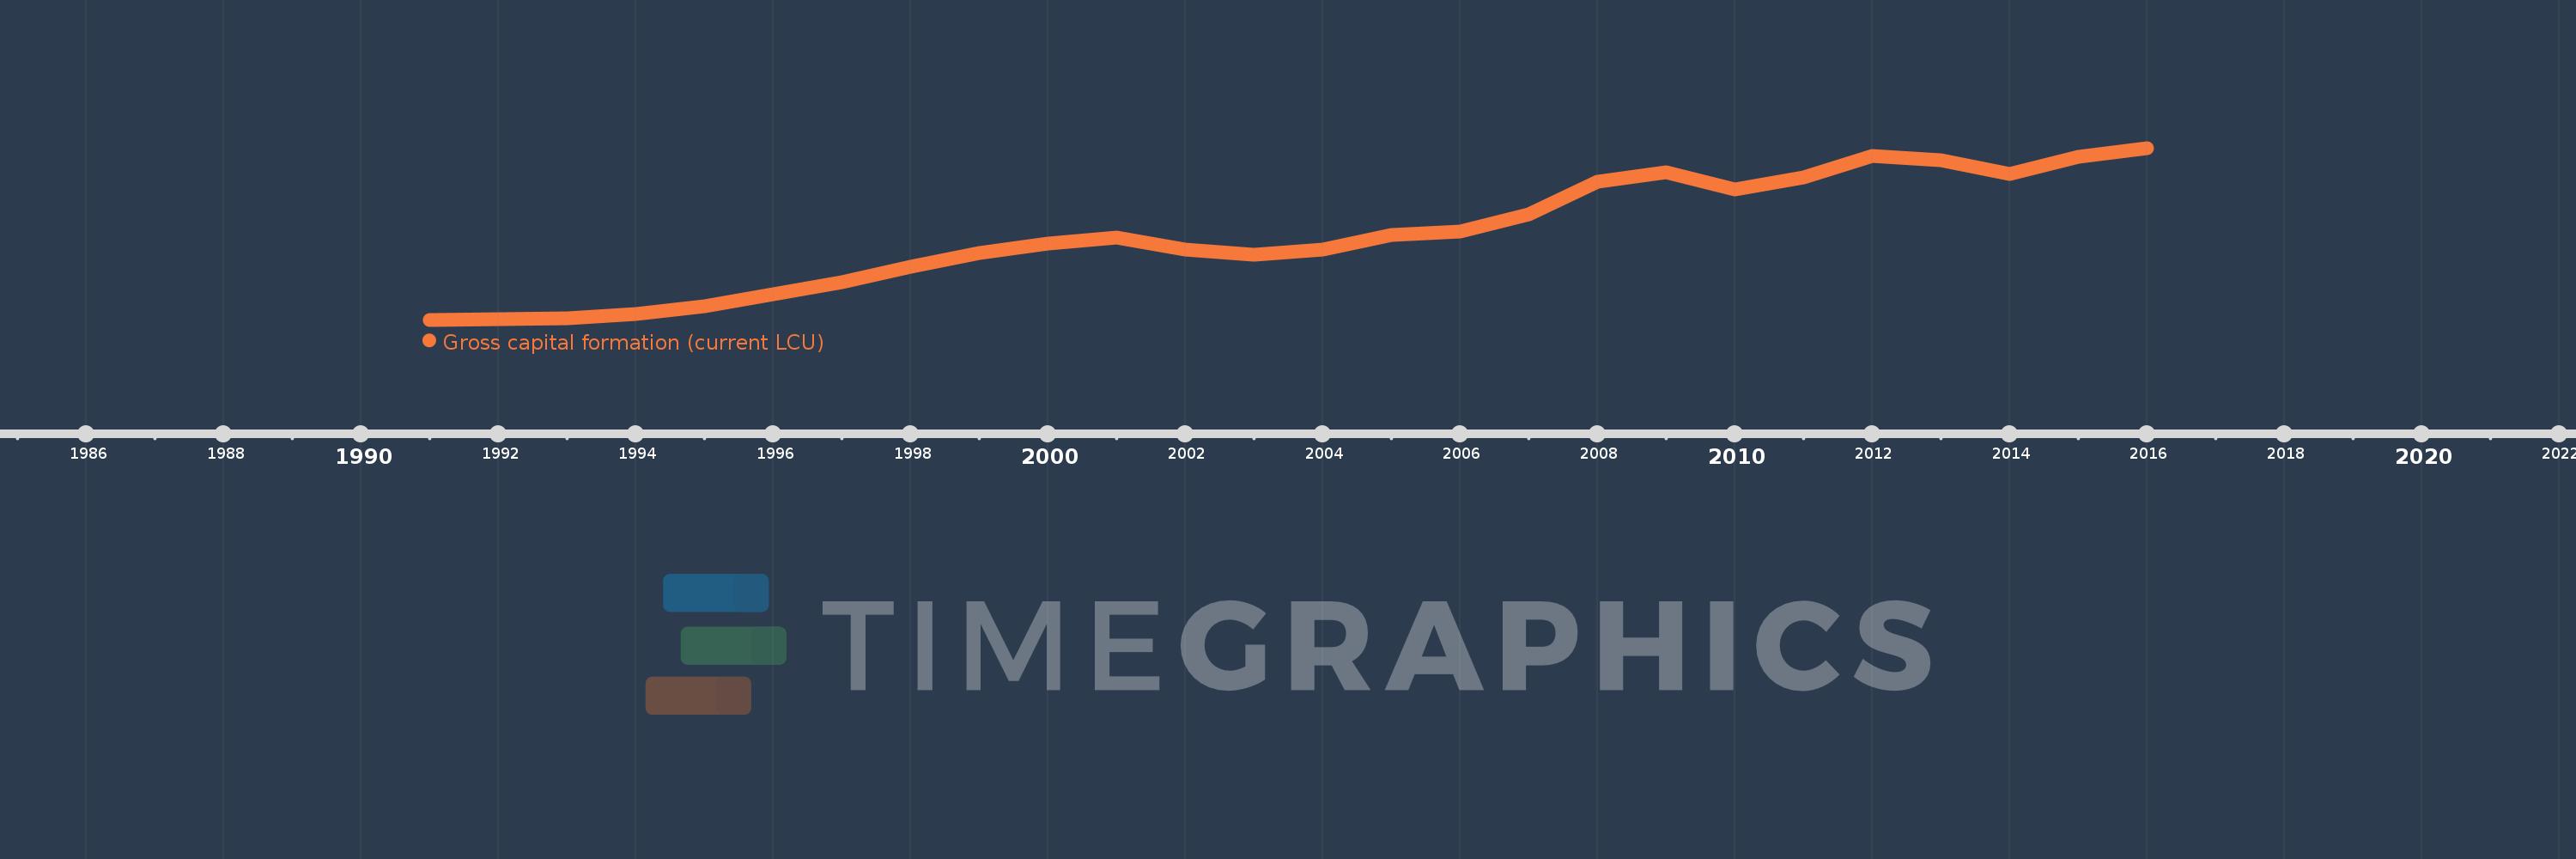
En esta escala de tiempo se presenta un gráfico de 1991 y 2016 de Poland. Los datos de 1990 están ausentes. El número de observaciones reales por fecha: 26.
Fuente (nombre):
Indicadores del desarrollo mundial
Fuente (organización):
World Bank national accounts data, and OECD National Accounts data files.
Categorías:
Economy & Growth
Se ha actualizado:
23 abr 2017 año
Los indicadores de los cambios de valor en los últimos años
En promedio:
189.93 bn
Mínimo:
16.036 bn
1 ene 1991 año
Máximo:
367.7 bn
1 ene 2016 año
A la fecha de observación
Valor
Cambio absoluto
El cambio con respecto al valor anterior
1 ene 1991 año
16.036 bn
+16.036 bn
0.0%
1 ene 1992 año
17.993 bn
+1.957 bn
12.2%
1 ene 1993 año
19.483 bn
+1.491 bn
8.29%
1 ene 1994 año
27.072 bn
+7.588 bn
38.95%
1 ene 1995 año
44.326 bn
+17.254 bn
63.74%
1 ene 1996 año
67.829 bn
+23.503 bn
53.02%
1 ene 1997 año
93.598 bn
+25.769 bn
37.99%
1 ene 1998 año
123.677 bn
+30.079 bn
32.14%
1 ene 1999 año
152.618 bn
+28.941 bn
23.4%
1 ene 2000 año
171.444 bn
+18.826 bn
12.34%
1 ene 2001 año
184.008 bn
+12.564 bn
7.33%
1 ene 2002 año
160.347 bn
-23.661 bn
-12.86%
1 ene 2003 año
149.522 bn
-10.825 bn
-6.75%
1 ene 2004 año
159.304 bn
+9.782 bn
6.54%
1 ene 2005 año
188.764 bn
+29.46 bn
18.49%
1 ene 2006 año
197.153 bn
+8.389 bn
4.44%
1 ene 2007 año
232.113 bn
+34.96 bn
17.73%
1 ene 2008 año
299.368 bn
+67.255 bn
28.98%
1 ene 2009 año
317.093 bn
+17.725 bn
5.92%
1 ene 2010 año
282.306 bn
-34.787 bn
-10.97%
1 ene 2011 año
308.04 bn
+25.734 bn
9.12%
1 ene 2012 año
351.592 bn
+43.552 bn
14.14%
1 ene 2013 año
342.031 bn
-9.561 bn
-2.72%
1 ene 2014 año
314.498 bn
-27.533 bn
-8.05%
1 ene 2015 año
350.256 bn
+35.758 bn
11.37%
1 ene 2016 año
367.7 bn
+17.444 bn
4.98%
Ranking de los países por los datos estadísticos actuales

Comentarios:

Enviar
PremiumAbout & FeedbackAcuerdoPrivacidad
logo
© 2022 Selected Technologies LLC – Morgan Hill, California