33
/es/
AIzaSyAYiBZKx7MnpbEhh9jyipgxe19OcubqV5w
August 1, 2025
224889
Poland
POL
true
2
1
Grants and other revenue (% of revenue)
2014,2013,2012,2011,2010,2009,2008,2007,2006,2005,2004,2003,2002,2001,2000,1999,1998,1997,1996,1995,1989,1988,1987,1986,1985
Download
Estadísticas Globales de la Biblioteca →Poland →

Grants and other revenue (% of revenue)

Estas estadísticas en otros países:

AfghanistanAlbaniaAlgeriaAngolaAntigua and BarbudaArab WorldArgentinaArmeniaAustraliaAustriaAzerbaijanBahamas, TheBahrainBangladeshBarbadosBelarusBelgiumBelizeBeninBhutanBoliviaBosnia and HerzegovinaBotswanaBrazilBulgariaBurkina FasoBurundiCabo VerdeCambodiaCanadaCaribbean small statesCentral African RepublicCentral Europe and the BalticsChileChinaColombiaCongo, Dem. Rep.Congo, Rep.Costa RicaCote d'IvoireCroatiaCyprusCzech RepublicDenmarkDominicaDominican RepublicEarly-demographic dividendEast Asia & PacificEast Asia & Pacific (excluding high income)East Asia & Pacific (IDA & IBRD countries)Egypt, Arab Rep.El SalvadorEquatorial GuineaEstoniaEthiopiaEuro areaEurope & Central AsiaEurope & Central Asia (excluding high income)Europe & Central Asia (IDA & IBRD countries)European UnionFijiFinlandFranceGambia, TheGeorgiaGermanyGhanaGreeceGrenadaGuatemalaHeavily indebted poor countries (HIPC)High incomeHondurasHong Kong SAR, ChinaHungaryIBRD onlyIcelandIDA & IBRD totalIDA blendIDA onlyIDA totalIndiaIndonesiaIran, Islamic Rep.IraqIrelandIsraelItalyJamaicaJapanJordanKazakhstanKenyaKiribatiKorea, Rep.KuwaitKyrgyz RepublicLao PDRLate-demographic dividendLatin America & Caribbean Latin America & Caribbean (excluding high income)Latin America & the Caribbean (IDA & IBRD countries)LatviaLeast developed countries: UN classificationLebanonLesothoLiberiaLithuaniaLow & middle incomeLow incomeLower middle incomeLuxembourgMacao SAR, ChinaMacedonia, FYRMadagascarMalawiMalaysiaMaldivesMaliMaltaMauritiusMexicoMicronesia, Fed. Sts.Middle East & North AfricaMiddle East & North Africa (excluding high income)Middle East & North Africa (IDA & IBRD countries)Middle incomeMoldovaMongoliaMoroccoMozambiqueMyanmarNamibiaNepalNetherlandsNew ZealandNicaraguaNigeriaNorth AmericaNorwayOECD membersOmanOther small statesPakistanPanamaPapua New GuineaParaguayPeruPhilippinesPolandPortugalPost-demographic dividendPre-demographic dividendQatarRomaniaRussian FederationRwandaSamoaSan MarinoSao Tome and PrincipeSenegalSerbiaSeychellesSierra LeoneSingaporeSlovak RepublicSloveniaSmall statesSolomon IslandsSouth AfricaSouth AsiaSouth Asia (IDA & IBRD)SpainSri LankaSt. Kitts and NevisSt. LuciaSt. Vincent and the GrenadinesSub-Saharan Africa Sub-Saharan Africa (excluding high income)Sub-Saharan Africa (IDA & IBRD countries)SurinameSwazilandSwedenSwitzerlandSyrian Arab RepublicTajikistanTanzaniaThailandTimor-LesteTogoTrinidad and TobagoTunisiaTurkeyUgandaUkraineUnited Arab EmiratesUnited KingdomUnited StatesUpper middle incomeUruguayVanuatuVenezuela, RBVietnamWest Bank and GazaWorldYemen, Rep.ZambiaZimbabwe

línea de tiempo (timeline):

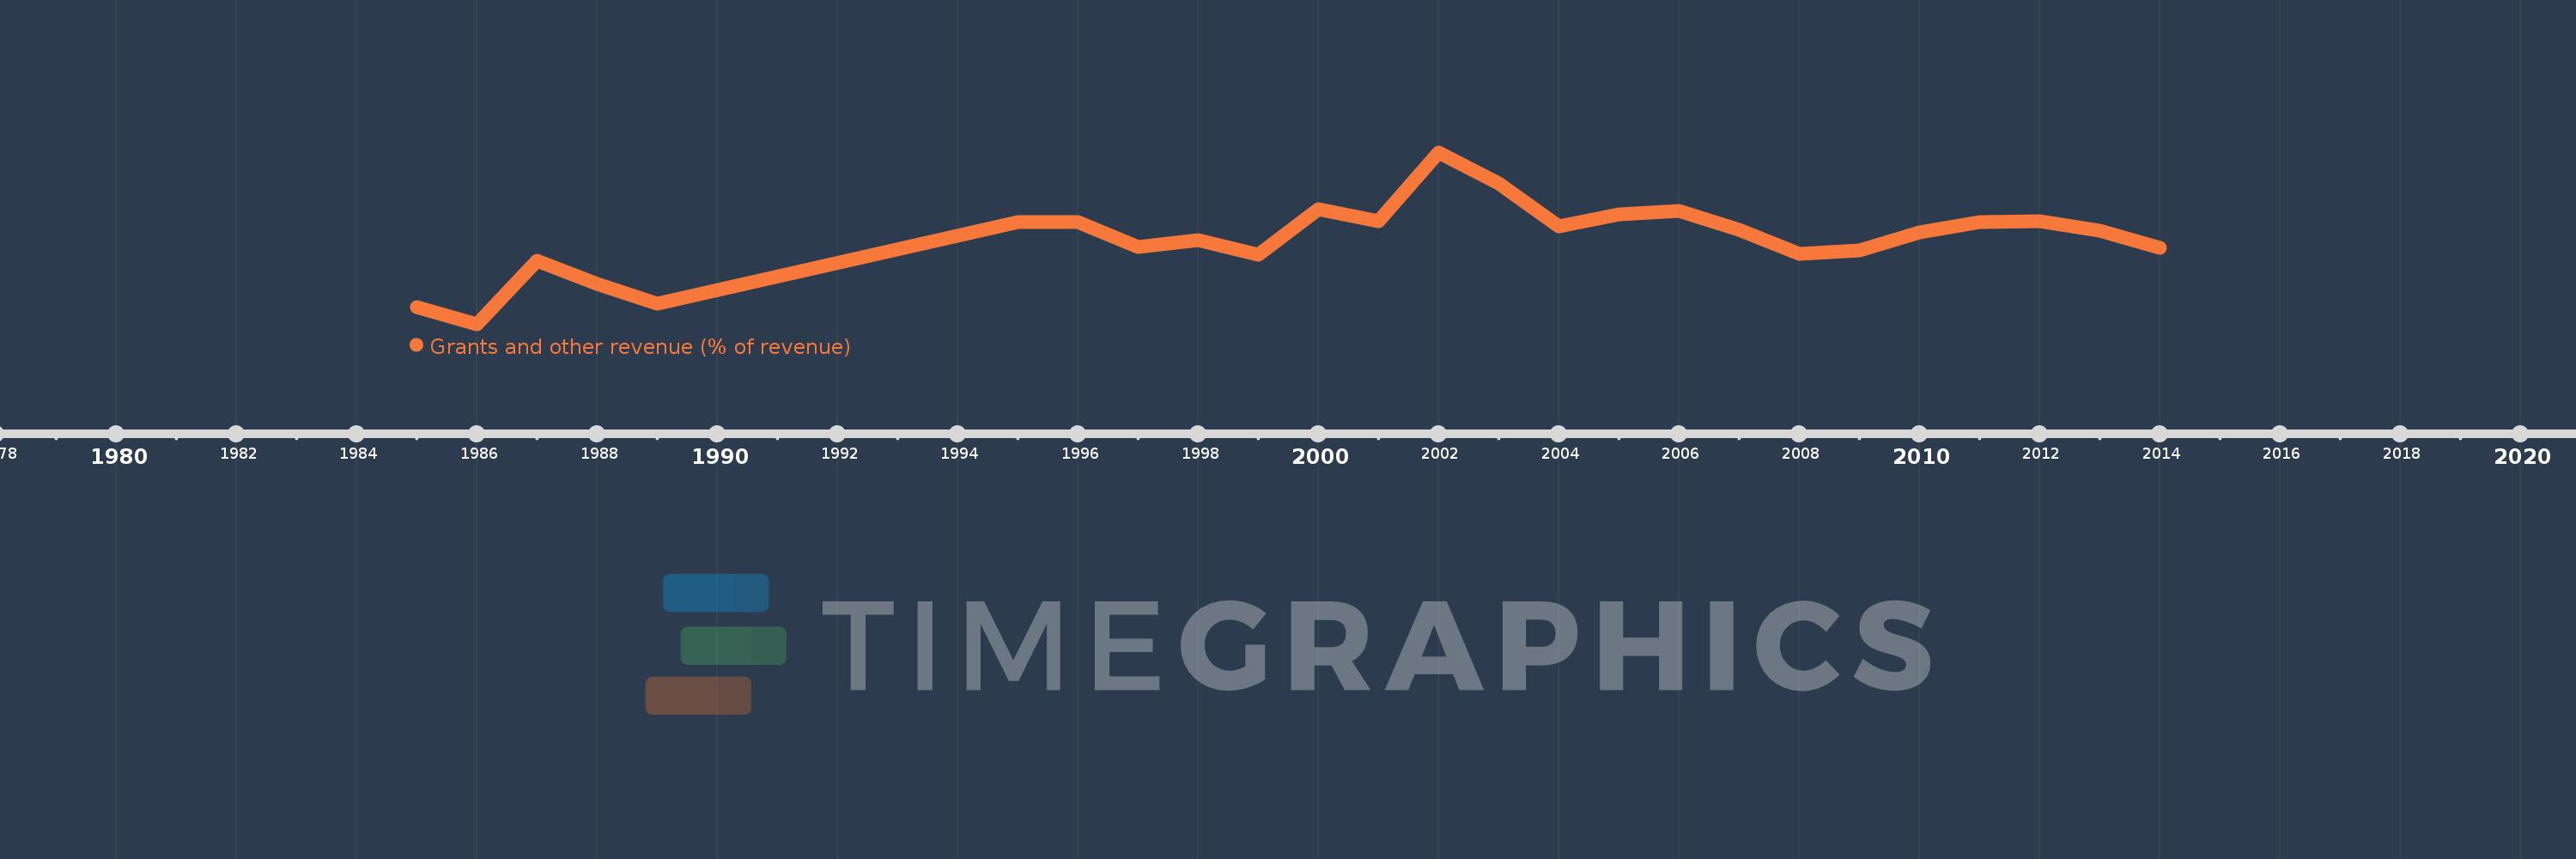
En esta escala de tiempo se presenta un gráfico de 1985 y 2014 de Poland. Los datos de 1984 están ausentes. El número de observaciones reales por fecha: 25.

Fuente (nombre):

Indicadores del desarrollo mundial

Fuente (organización):

International Monetary Fund, Government Finance Statistics Yearbook and data files.

Categorías:

Public Sector

Se ha actualizado:

23 abr 2017 año

Los indicadores de los cambios de valor en los últimos años

En promedio:
9.251
Mínimo:
4.169
1 ene 1986 año
Máximo:
14.394
1 ene 2002 año
A la fecha de observación
Valor
Cambio absoluto
El cambio con respecto al valor anterior
1 ene 1985 año
5.199
+5.199
0.0%
1 ene 1986 año
4.169
-1.03
-19.81%
1 ene 1987 año
7.961
+3.792
90.95%
1 ene 1988 año
6.553
-1.409
-17.69%
1 ene 1989 año
5.385
-1.167
-17.81%
1 ene 1995 año
10.268
+4.883
90.66%
1 ene 1996 año
10.224
-0.044
-0.43%
1 ene 1997 año
8.786
-1.437
-14.06%
1 ene 1998 año
9.153
+0.367
4.18%
1 ene 1999 año
8.316
-0.837
-9.15%
1 ene 2000 año
11.021
+2.705
32.53%
1 ene 2001 año
10.304
-0.717
-6.51%
1 ene 2002 año
14.394
+4.09
39.69%
1 ene 2003 año
12.536
-1.857
-12.9%
1 ene 2004 año
10.008
-2.528
-20.16%
1 ene 2005 año
10.694
+0.685
6.85%
1 ene 2006 año
10.933
+0.239
2.23%
1 ene 2007 año
9.808
-1.125
-10.29%
1 ene 2008 año
8.379
-1.429
-14.57%
1 ene 2009 año
8.536
+0.157
1.87%
1 ene 2010 año
9.636
+1.101
12.9%
1 ene 2011 año
10.225
+0.588
6.1%
1 ene 2012 año
10.301
+0.077
0.75%
1 ene 2013 año
9.753
-0.548
-5.32%
1 ene 2014 año
8.735
-1.018
-10.43%

Ranking de los países por los datos estadísticos actuales