33
/es/
AIzaSyAYiBZKx7MnpbEhh9jyipgxe19OcubqV5w
May 1, 2025
221252
Paraguay
PRY
true
2
1
Net taxes on products (constant LCU)
2016,2015,2014,2013,2012,2011,2010,2009,2008,2007,2006,2005,2004,2003,2002,2001,2000,1999,1998,1997,1996,1995,1994,1993,1992
Download
Estadísticas Globales de la Biblioteca →Paraguay →

Net taxes on products (constant LCU)

Estas estadísticas en otros países:

AfghanistanAlbaniaAlgeriaAntigua and BarbudaArgentinaArmeniaAustraliaAustriaAzerbaijanBahamas, TheBangladeshBelarusBelgiumBelizeBeninBermudaBhutanBoliviaBosnia and HerzegovinaBotswanaBrazilBulgariaBurkina FasoBurundiCabo VerdeCambodiaCameroonCanadaCentral African RepublicChadChileColombiaCongo, Dem. Rep.Costa RicaCroatiaCubaCyprusCzech RepublicDenmarkDjiboutiDominicaDominican RepublicEcuadorEl SalvadorEquatorial GuineaEritreaEstoniaEthiopiaFijiFinlandFranceGabonGambia, TheGeorgiaGermanyGhanaGreeceGrenadaGuatemalaGuineaGuinea-BissauGuyanaHaitiHondurasHong Kong SAR, ChinaHungaryIndiaIndonesiaIran, Islamic Rep.IrelandItalyJamaicaJapanJordanKazakhstanKenyaKiribatiKorea, Rep.KosovoKyrgyz RepublicLao PDRLatviaLebanonLesothoLiberiaLithuaniaLuxembourgMacedonia, FYRMadagascarMalawiMaldivesMaliMarshall IslandsMauritaniaMauritiusMexicoMicronesia, Fed. Sts.MoldovaMongoliaMontenegroMoroccoMozambiqueNamibiaNepalNetherlandsNew ZealandNicaraguaNigerNigeriaNorwayOmanPakistanPalauPanamaPapua New GuineaParaguayPeruPhilippinesPolandPortugalRomaniaRussian FederationRwandaSao Tome and PrincipeSenegalSerbiaSeychellesSierra LeoneSingaporeSlovak RepublicSloveniaSolomon IslandsSomaliaSouth AfricaSpainSri LankaSt. Kitts and NevisSt. LuciaSt. Vincent and the GrenadinesSudanSurinameSwazilandSwedenSwitzerlandTajikistanTanzaniaTimor-LesteTongaTrinidad and TobagoTunisiaTurkeyTuvaluUgandaUkraineUnited Arab EmiratesUnited KingdomUnited StatesUruguayUzbekistanVanuatuVenezuela, RBVietnamWest Bank and GazaZambiaZimbabwe

línea de tiempo (timeline):

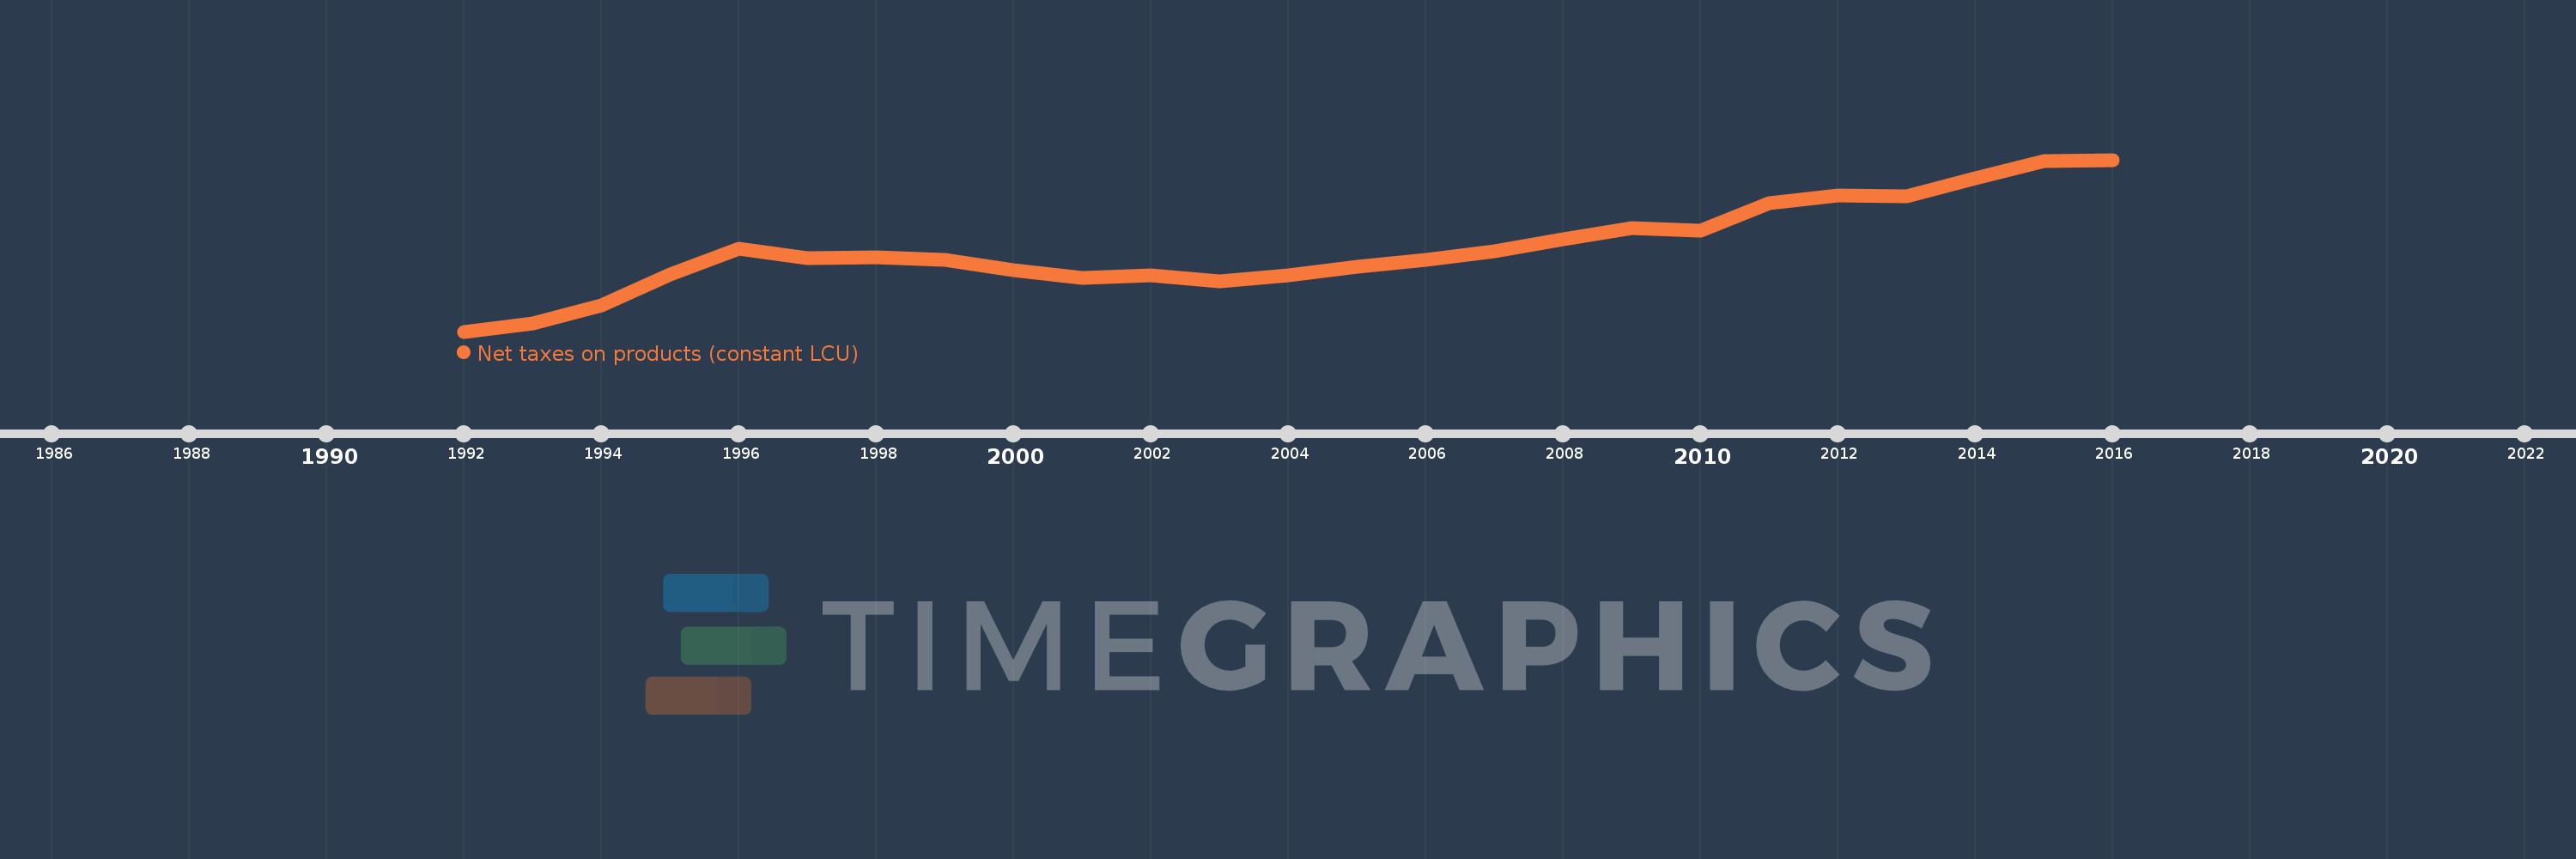
En esta escala de tiempo se presenta un gráfico de 1992 y 2016 de Paraguay. Los datos de 1991 están ausentes. El número de observaciones reales por fecha: 25.

Fuente (nombre):

Indicadores del desarrollo mundial

Fuente (organización):

World Bank national accounts data, and OECD National Accounts data files.

Categorías:

Economy & Growth

Se ha actualizado:

23 abr 2017 año

Los indicadores de los cambios de valor en los últimos años

En promedio:
1.29 billones
Mínimo:
782.363 bn
1 ene 1992 año
Máximo:
1.831 billones
1 ene 2016 año
A la fecha de observación
Valor
Cambio absoluto
El cambio con respecto al valor anterior
1 ene 1992 año
782.363 bn
+782.363 bn
0.0%
1 ene 1993 año
829.818 bn
+47.455 bn
6.07%
1 ene 1994 año
944.894 bn
+115.077 bn
13.87%
1 ene 1995 año
1.129 billones
+184.448 bn
19.52%
1 ene 1996 año
1.291 billones
+161.482 bn
14.3%
1 ene 1997 año
1.232 billones
-59.29 bn
-4.59%
1 ene 1998 año
1.234 billones
+2.203 bn
0.18%
1 ene 1999 año
1.218 billones
-16.029 bn
-1.3%
1 ene 2000 año
1.157 billones
-60.508 bn
-4.97%
1 ene 2001 año
1.108 billones
-49.215 bn
-4.25%
1 ene 2002 año
1.124 billones
+16.092 bn
1.45%
1 ene 2003 año
1.091 billones
-33.264 bn
-2.96%
1 ene 2004 año
1.128 billones
+37.465 bn
3.43%
1 ene 2005 año
1.179 billones
+50.391 bn
4.47%
1 ene 2006 año
1.222 billones
+43.611 bn
3.7%
1 ene 2007 año
1.275 billones
+52.558 bn
4.3%
1 ene 2008 año
1.345 billones
+70.116 bn
5.5%
1 ene 2009 año
1.412 billones
+67.247 bn
5.0%
1 ene 2010 año
1.398 billones
-14.122 bn
-1.0%
1 ene 2011 año
1.566 billones
+167.77 bn
12.0%
1 ene 2012 año
1.613 billones
+46.975 bn
3.0%
1 ene 2013 año
1.608 billones
-4.838 bn
-0.3%
1 ene 2014 año
1.719 billones
+110.951 bn
6.9%
1 ene 2015 año
1.822 billones
+103.136 bn
6.0%
1 ene 2016 año
1.831 billones
+9.11 bn
0.5%

Ranking de los países por los datos estadísticos actuales