33
/es/
AIzaSyAYiBZKx7MnpbEhh9jyipgxe19OcubqV5w
May 1, 2025
215832
Oman
OMN
true
2
1
Survival rate to Grade 5 of primary education, both sexes (%)
2013,2012,2003,2002,2001,2000,1999,1995,1993,1991,1990,1989,1988,1987,1986,1985,1984,1980,1979,1976,1975
Download
Estadísticas Globales de la Biblioteca →Oman →

Survival rate to Grade 5 of primary education, both sexes (%)

Estas estadísticas en otros países:

AfghanistanAlbaniaAlgeriaAndorraAngolaAntigua and BarbudaArab WorldArgentinaArubaBahamas, TheBahrainBangladeshBarbadosBelarusBelgiumBelizeBeninBermudaBhutanBoliviaBosnia and HerzegovinaBotswanaBritish Virgin IslandsBrunei DarussalamBurkina FasoBurundiCabo VerdeCambodiaCameroonCanadaCaribbean small statesCayman IslandsCentral African RepublicChadChileChinaColombiaComorosCongo, Dem. Rep.Congo, Rep.Costa RicaCote d'IvoireCubaCyprusCzech RepublicDenmarkDjiboutiDominicaDominican RepublicEarly-demographic dividendEast Asia & PacificEast Asia & Pacific (excluding high income)East Asia & Pacific (IDA & IBRD countries)EcuadorEgypt, Arab Rep.El SalvadorEquatorial GuineaEritreaEstoniaEthiopiaFijiFinlandFranceGabonGambia, TheGeorgiaGhanaGreeceGrenadaGuatemalaGuineaGuinea-BissauGuyanaHaitiHeavily indebted poor countries (HIPC)HondurasHong Kong SAR, ChinaHungaryIBRD onlyIcelandIDA blendIDA onlyIDA totalIndiaIndonesiaIran, Islamic Rep.IraqIrelandIsraelItalyJamaicaJapanJordanKenyaKiribatiKorea, Rep.KuwaitLao PDRLate-demographic dividendLatviaLeast developed countries: UN classificationLebanonLesothoLiberiaLibyaLiechtensteinLow incomeLower middle incomeLuxembourgMacao SAR, ChinaMadagascarMalawiMalaysiaMaldivesMaliMaltaMarshall IslandsMauritaniaMauritiusMexicoMiddle East & North AfricaMiddle East & North Africa (excluding high income)Middle East & North Africa (IDA & IBRD countries)MonacoMontenegroMoroccoMozambiqueMyanmarNamibiaNepalNetherlandsNicaraguaNigerNigeriaNorwayOmanOther small statesPacific island small statesPakistanPanamaPapua New GuineaParaguayPeruPhilippinesPolandPortugalPre-demographic dividendQatarRwandaSamoaSan MarinoSao Tome and PrincipeSaudi ArabiaSenegalSeychellesSierra LeoneSingaporeSloveniaSolomon IslandsSouth AfricaSouth AsiaSouth Asia (IDA & IBRD)SpainSri LankaSt. Kitts and NevisSt. LuciaSt. Vincent and the GrenadinesSub-Saharan Africa Sub-Saharan Africa (excluding high income)Sub-Saharan Africa (IDA & IBRD countries)SudanSurinameSwazilandSwedenSwitzerlandSyrian Arab RepublicTanzaniaThailandTimor-LesteTogoTongaTrinidad and TobagoTunisiaTurkeyTuvaluUgandaUnited Arab EmiratesUpper middle incomeUruguayVanuatuVenezuela, RBVietnamYemen, Rep.ZambiaZimbabwe

línea de tiempo (timeline):

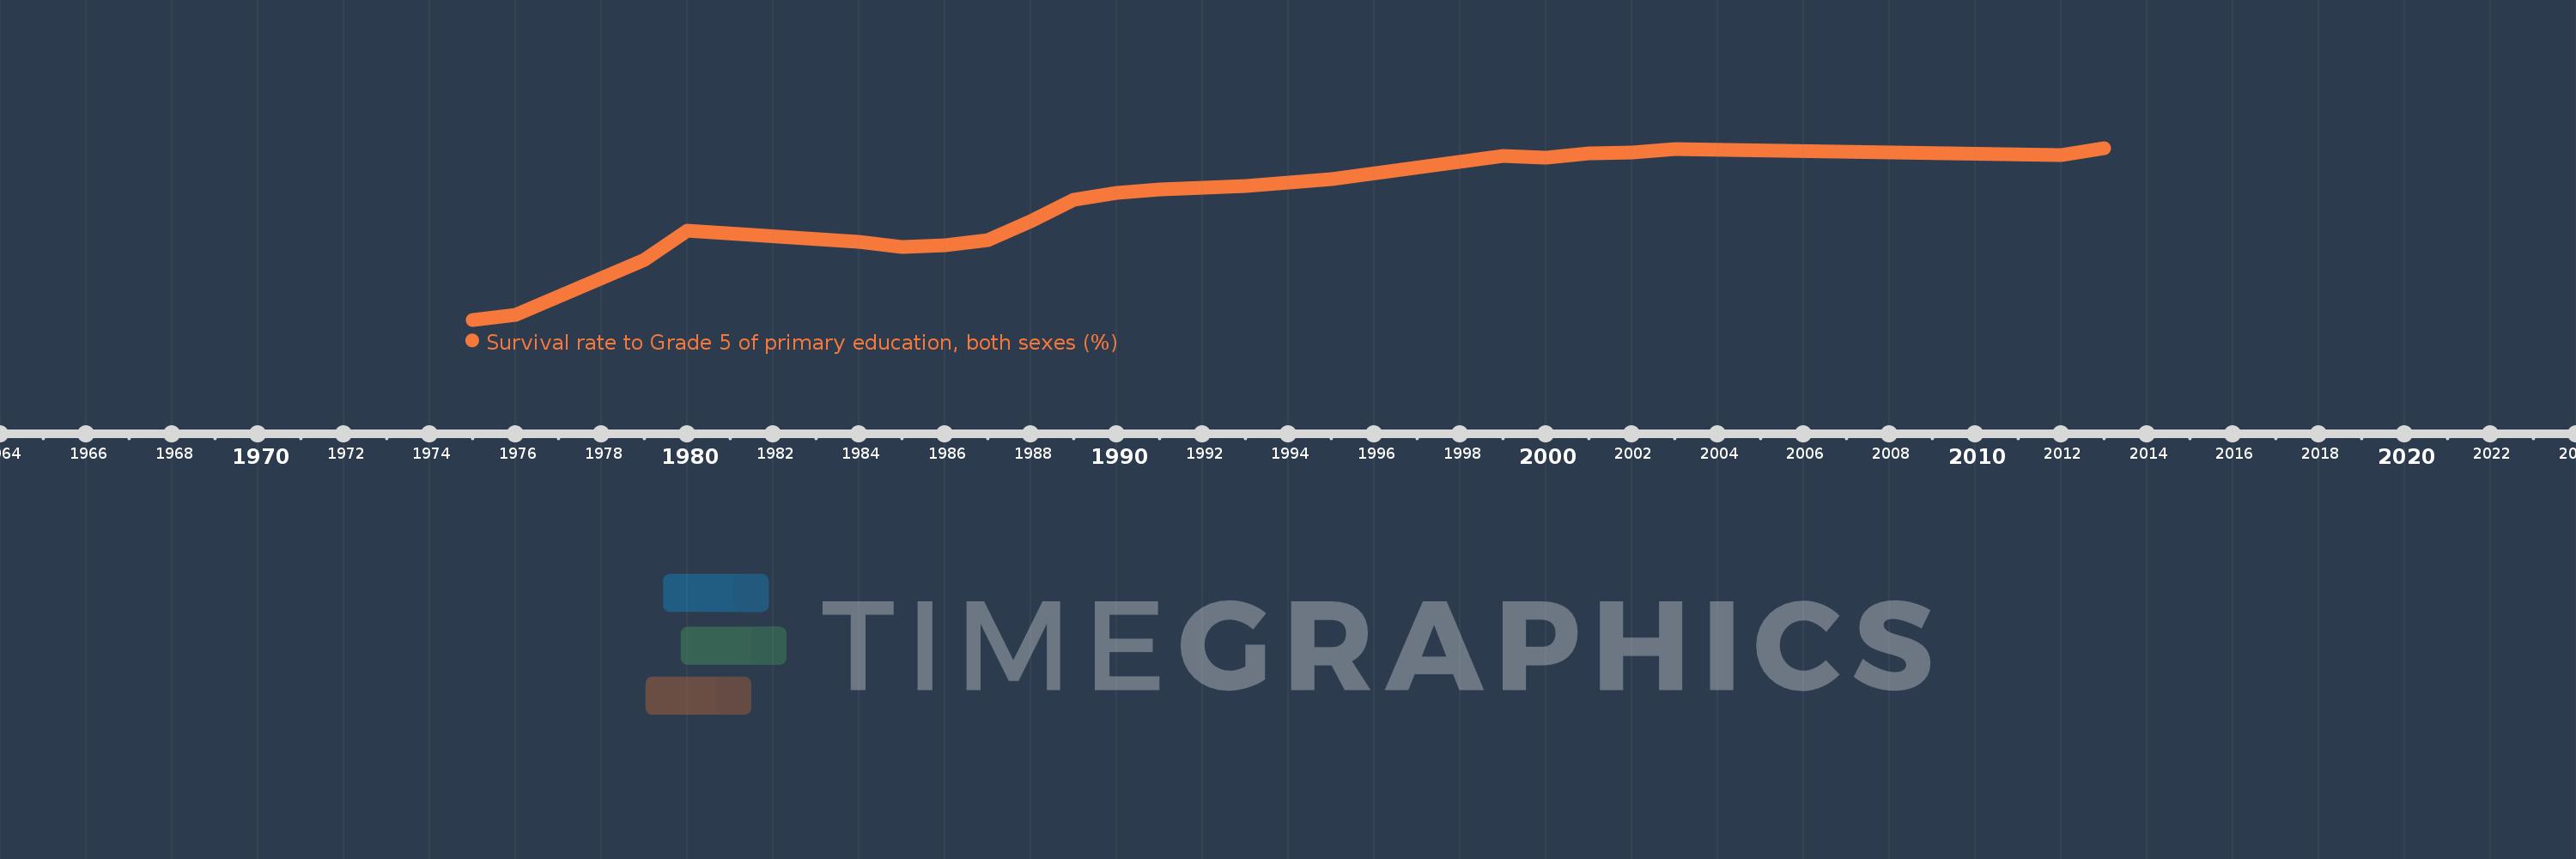
En esta escala de tiempo se presenta un gráfico de 1975 y 2013 de Oman. Los datos de 1974 están ausentes. El número de observaciones reales por fecha: 21.

Fuente (nombre):

Indicadores del desarrollo mundial

Fuente (organización):

UNESCO Institute for Statistics

Categorías:

Education

Se ha actualizado:

23 abr 2017 año

Los indicadores de los cambios de valor en los últimos años

En promedio:
68.005
Mínimo:
8.684
1 ene 1975 año
Máximo:
98.767
1 ene 2013 año
A la fecha de observación
Valor
Cambio absoluto
El cambio con respecto al valor anterior
1 ene 1975 año
8.684
+8.684
0.0%
1 ene 1976 año
11.291
+2.608
30.03%
1 ene 1979 año
40.025
+28.734
254.48%
1 ene 1980 año
55.598
+15.573
38.91%
1 ene 1984 año
49.519
-6.08
-10.93%
1 ene 1985 año
46.905
-2.613
-5.28%
1 ene 1986 año
47.576
+0.671
1.43%
1 ene 1987 año
50.583
+3.006
6.32%
1 ene 1988 año
60.285
+9.703
19.18%
1 ene 1989 año
71.57
+11.285
18.72%
1 ene 1990 año
75.357
+3.788
5.29%
1 ene 1991 año
77.138
+1.781
2.36%
1 ene 1993 año
78.734
+1.595
2.07%
1 ene 1995 año
82.432
+3.699
4.7%
1 ene 1999 año
94.559
+12.126
14.71%
1 ene 2000 año
93.739
-0.819
-0.87%
1 ene 2001 año
95.923
+2.183
2.33%
1 ene 2002 año
96.243
+0.32
0.33%
1 ene 2003 año
97.957
+1.714
1.78%
1 ene 2012 año
95.22
-2.737
-2.79%
1 ene 2013 año
98.767
+3.547
3.72%

Ranking de los países por los datos estadísticos actuales