33
/es/
AIzaSyB4mHJ5NPEv-XzF7P6NDYXjlkCWaeKw5bc
November 1, 2025
213920
Northern Mariana Islands
MNP
true
2
1
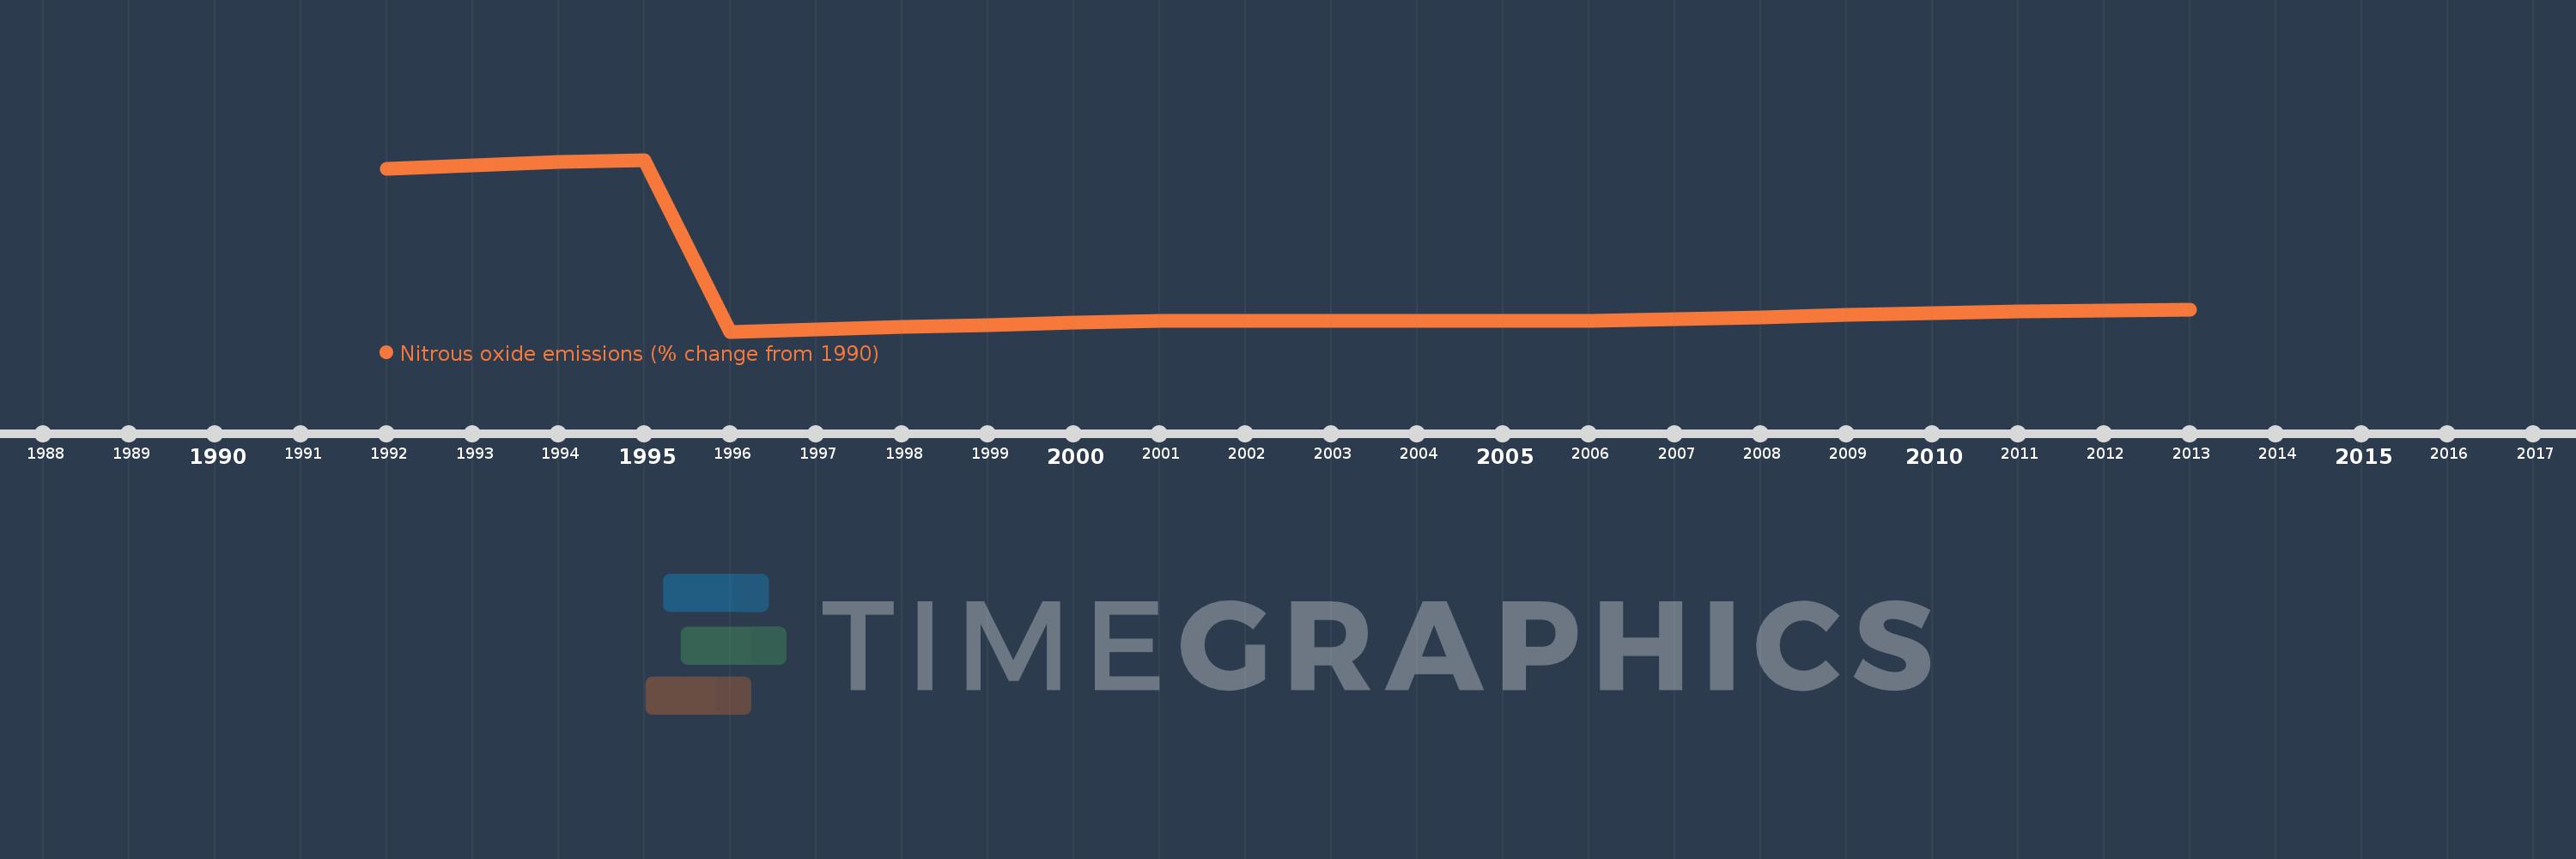
Nitrous oxide emissions (% change from 1990)
2013,2012,2011,2010,2009,2008,2007,2006,2005,2004,2003,2002,2001,2000,1999,1998,1997,1996,1995,1994,1993,1992