33
/es/
AIzaSyB4mHJ5NPEv-XzF7P6NDYXjlkCWaeKw5bc
November 1, 2025
213861
Northern Mariana Islands
MNP
true
2
1
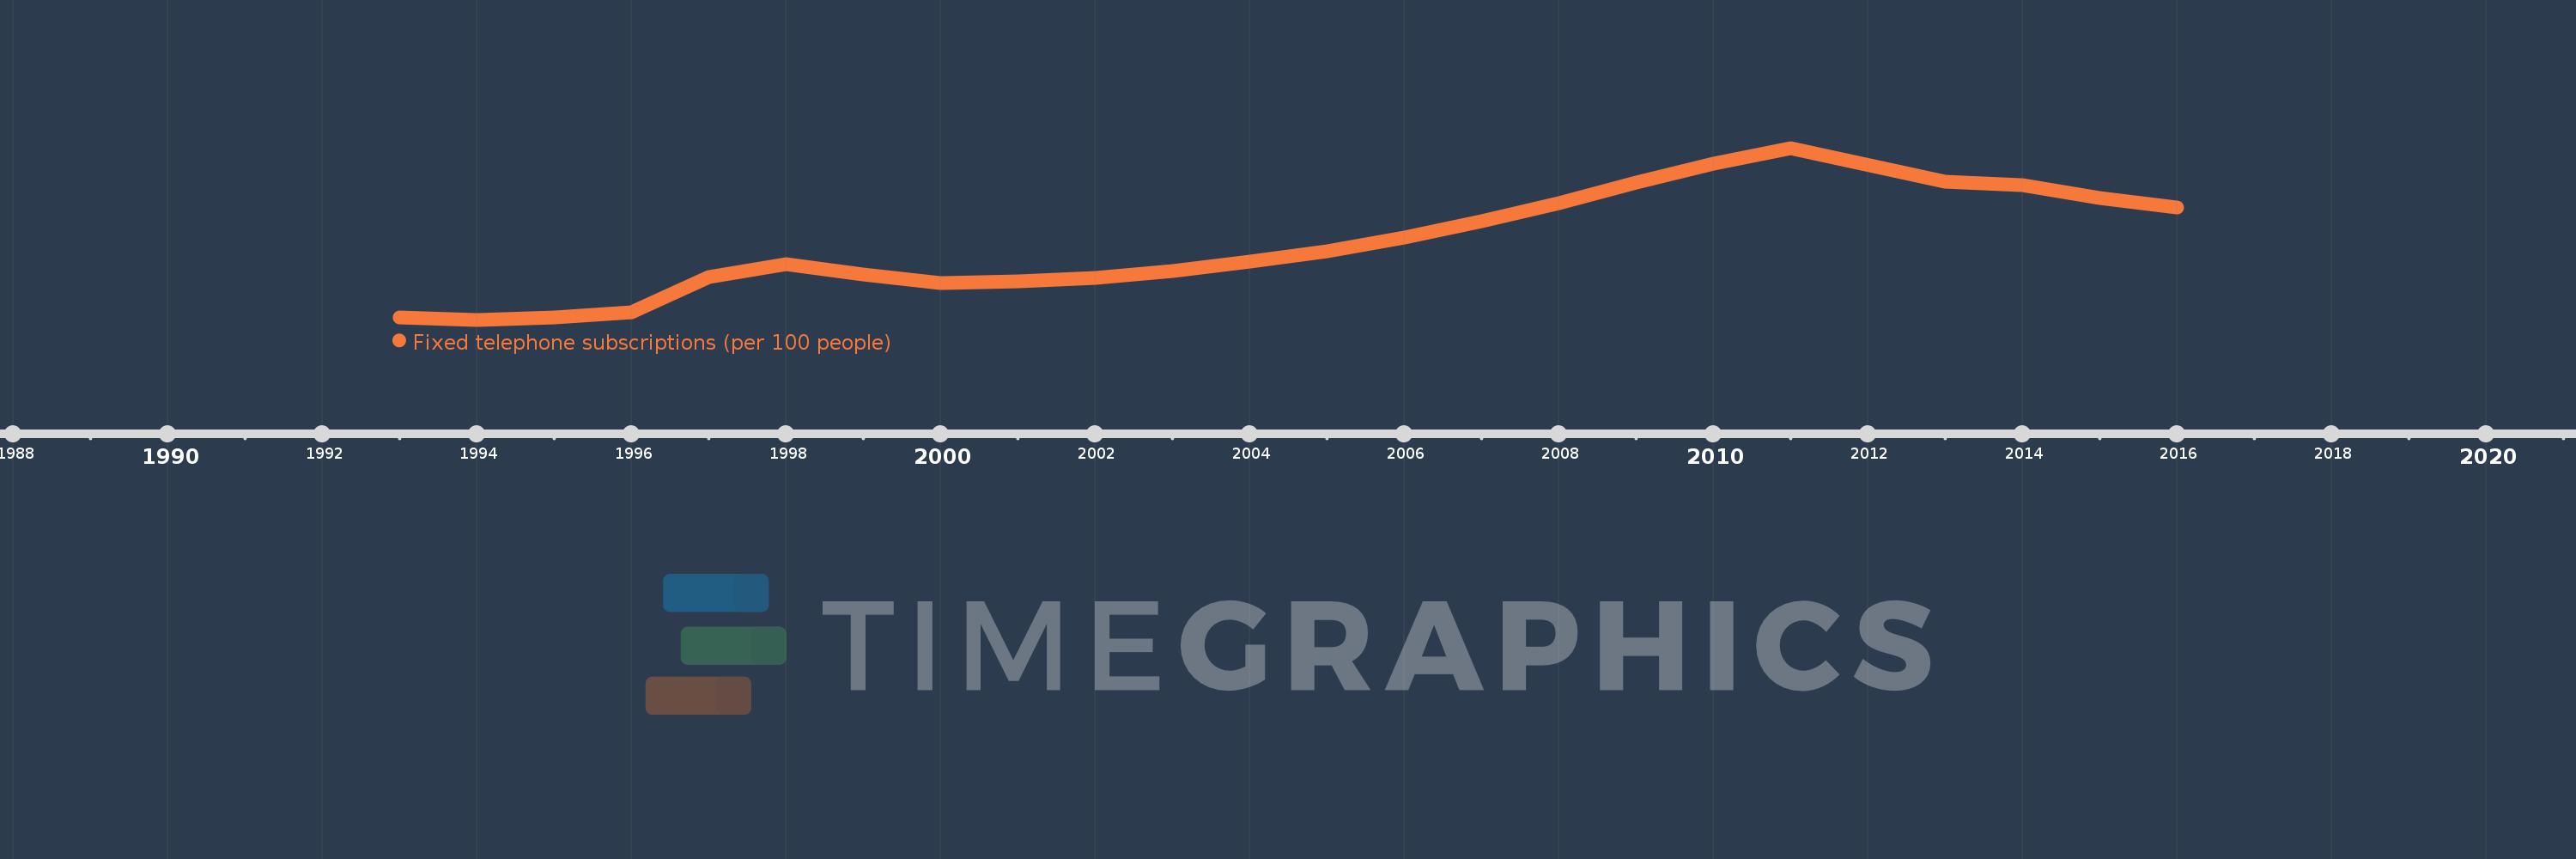
Fixed telephone subscriptions (per 100 people)
2016,2015,2014,2013,2011,2010,2009,2008,2007,2006,2005,2004,2003,2002,2001,2000,1999,1998,1997,1996,1995,1994,1993