33
/es/
AIzaSyB4mHJ5NPEv-XzF7P6NDYXjlkCWaeKw5bc
November 30, 2025
207653
Netherlands
NLD
true
2
1
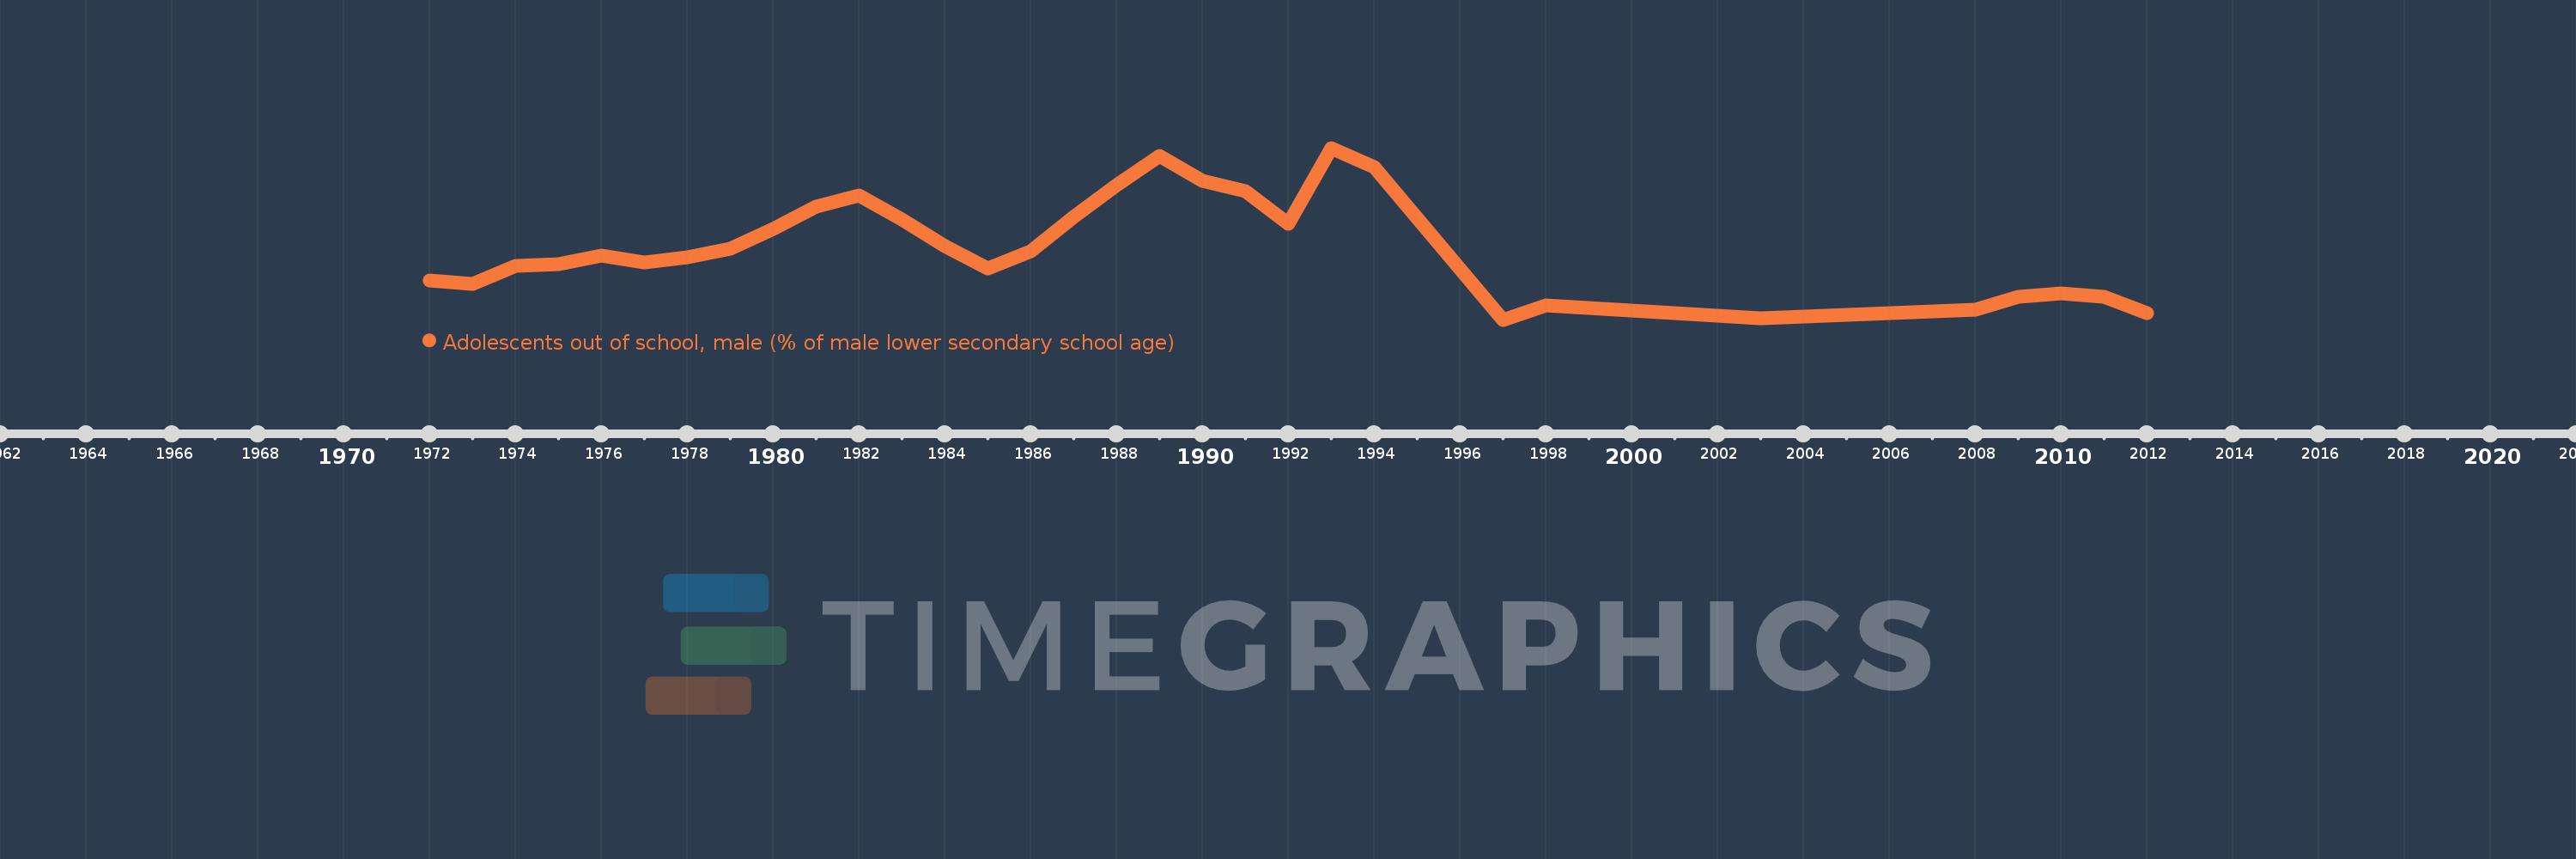
Adolescents out of school, male (% of male lower secondary school age)
2012,2011,2010,2009,2008,2003,1998,1997,1994,1993,1992,1991,1990,1989,1988,1987,1986,1985,1984,1983,1982,1981,1980,1979,1978,1977,1976,1975,1974,1973,1972