33
/es/
AIzaSyAYiBZKx7MnpbEhh9jyipgxe19OcubqV5w
August 1, 2025
200961
Montenegro
MNE
true
2
1
Public and publicly guaranteed debt service (% of exports of goods, services and primary income)
2016,2015,2014,2013,2012,2011,2010,2009,2008
Download
Estadísticas Globales de la Biblioteca →Montenegro →

Public and publicly guaranteed debt service (% of exports of goods, services and primary income)

Estas estadísticas en otros países:

AfghanistanAlbaniaAlgeriaAngolaArgentinaArmeniaAzerbaijanBangladeshBelarusBelizeBeninBhutanBoliviaBosnia and HerzegovinaBotswanaBrazilBulgariaBurkina FasoBurundiCabo VerdeCambodiaCameroonCentral African RepublicChadChinaColombiaComorosCongo, Dem. Rep.Congo, Rep.Costa RicaCote d'IvoireDjiboutiDominicaDominican RepublicEarly-demographic dividendEast Asia & Pacific (excluding high income)East Asia & Pacific (IDA & IBRD countries)EcuadorEgypt, Arab Rep.El SalvadorEritreaEthiopiaEurope & Central Asia (excluding high income)Europe & Central Asia (IDA & IBRD countries)FijiFragile and conflict affected situationsGabonGambia, TheGeorgiaGhanaGrenadaGuatemalaGuineaGuinea-BissauGuyanaHaitiHeavily indebted poor countries (HIPC)HondurasIBRD onlyIDA & IBRD totalIDA blendIDA onlyIDA totalIndiaIndonesiaIran, Islamic Rep.JamaicaJordanKazakhstanKenyaKosovoKyrgyz RepublicLao PDRLate-demographic dividendLatin America & Caribbean Latin America & Caribbean (excluding high income)Latin America & the Caribbean (IDA & IBRD countries)Least developed countries: UN classificationLebanonLesothoLiberiaLow & middle incomeLow incomeLower middle incomeMacedonia, FYRMadagascarMalawiMalaysiaMaldivesMaliMauritaniaMauritiusMexicoMiddle East & North Africa (excluding high income)Middle East & North Africa (IDA & IBRD countries)Middle incomeMoldovaMongoliaMontenegroMoroccoMozambiqueMyanmarNepalNicaraguaNigerNigeriaPacific island small statesPakistanPanamaPapua New GuineaParaguayPeruPhilippinesPre-demographic dividendRomaniaRussian FederationRwandaSamoaSao Tome and PrincipeSenegalSerbiaSierra LeoneSolomon IslandsSouth AfricaSouth AsiaSouth Asia (IDA & IBRD)Sri LankaSt. Kitts and NevisSt. LuciaSt. Vincent and the GrenadinesSub-Saharan Africa Sub-Saharan Africa (excluding high income)Sub-Saharan Africa (IDA & IBRD countries)SudanSwazilandSyrian Arab RepublicTajikistanTanzaniaThailandTogoTongaTunisiaTurkeyUgandaUkraineUpper middle incomeVanuatuVenezuela, RBVietnamYemen, Rep.ZambiaZimbabwe

línea de tiempo (timeline):

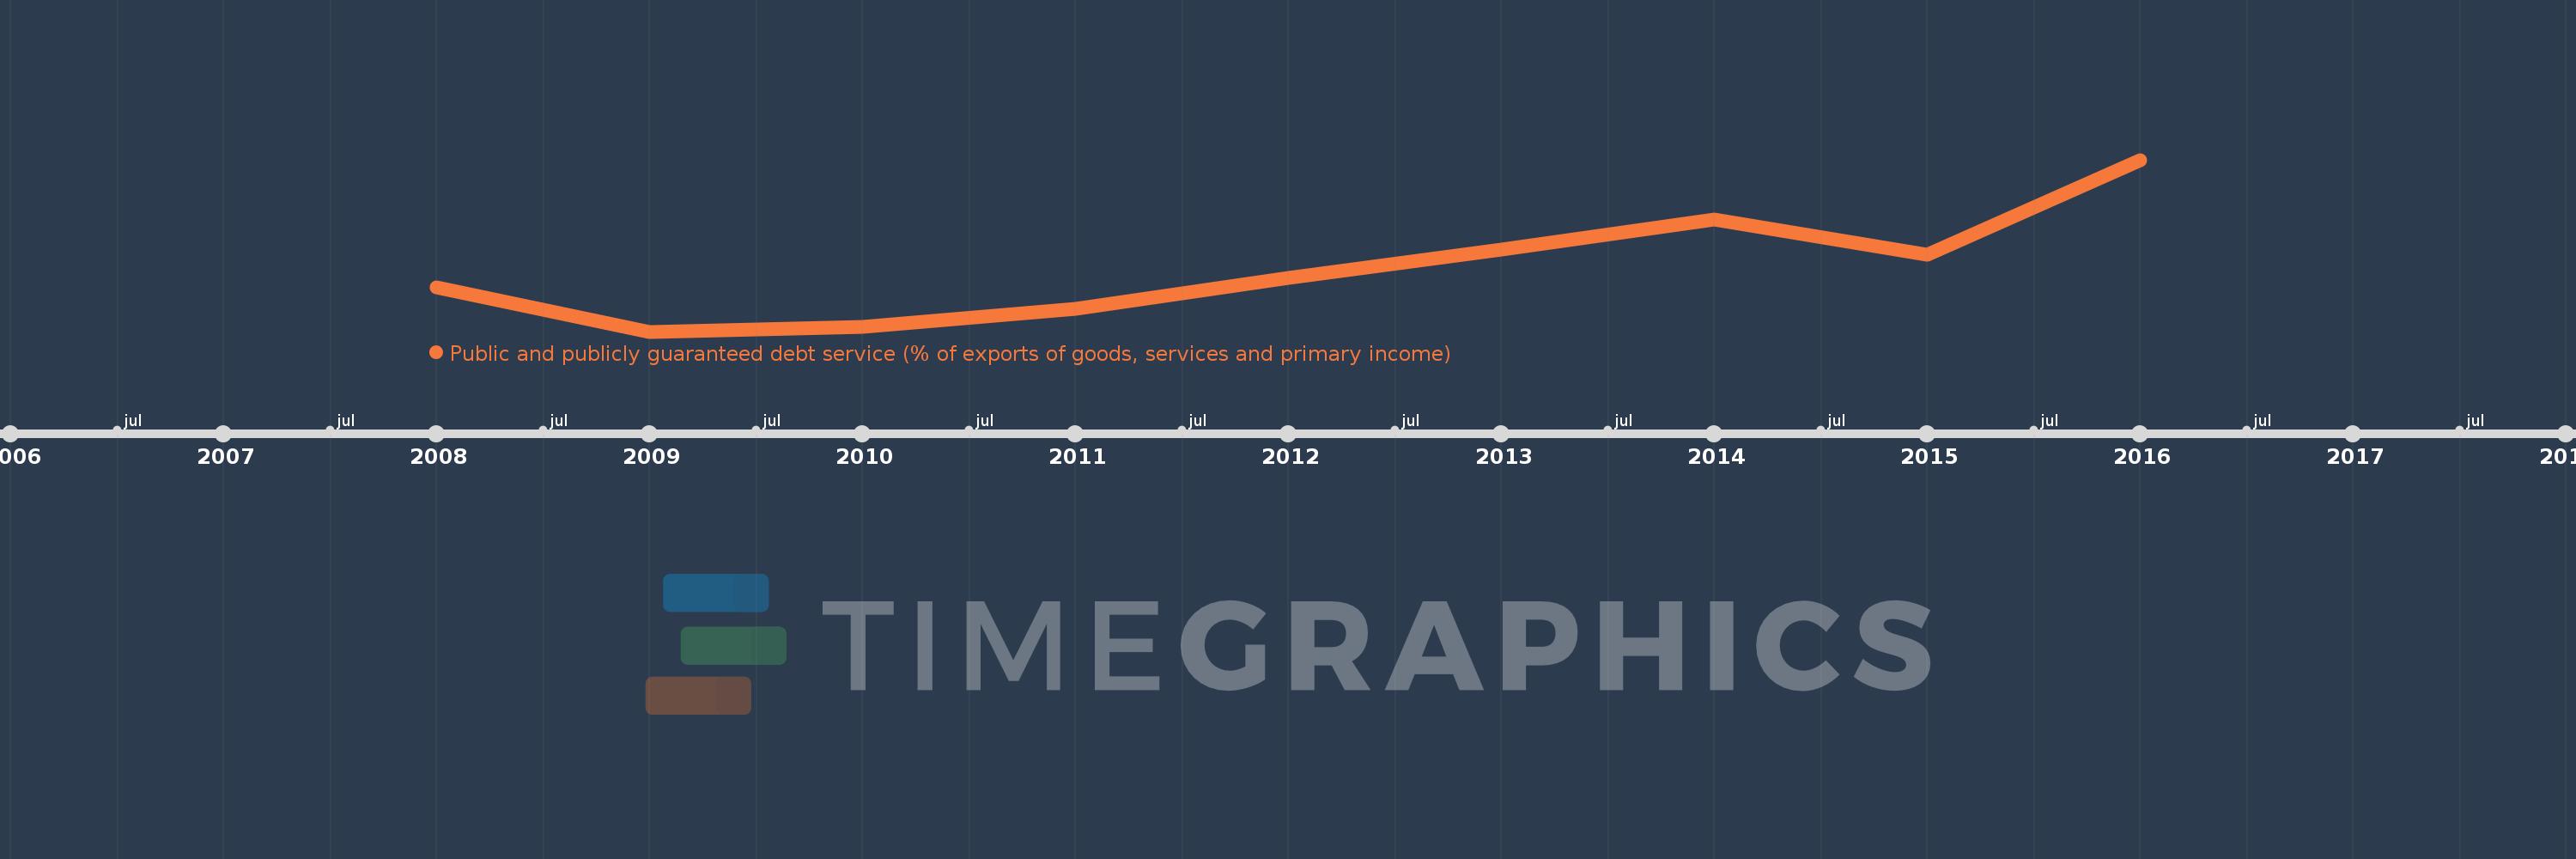
En esta escala de tiempo se presenta un gráfico de 2008 y 2016 de Montenegro. Los datos de 2007 están ausentes. El número de observaciones reales por fecha: 9.

Fuente (nombre):

Indicadores del desarrollo mundial

Fuente (organización):

World Bank.

Categorías:

External Debt

Se ha actualizado:

23 abr 2017 año

Los indicadores de los cambios de valor en los últimos años

En promedio:
10.416
Mínimo:
2.53
1 ene 2009 año
Máximo:
23.974
1 ene 2016 año
A la fecha de observación
Valor
Cambio absoluto
El cambio con respecto al valor anterior
1 ene 2008 año
8.09
+8.09
0.0%
1 ene 2009 año
2.53
-5.56
-68.72%
1 ene 2010 año
3.086
+0.555
21.94%
1 ene 2011 año
5.403
+2.317
75.1%
1 ene 2012 año
9.238
+3.835
70.97%
1 ene 2013 año
12.802
+3.564
38.58%
1 ene 2014 año
16.54
+3.738
29.2%
1 ene 2015 año
12.081
-4.459
-26.96%
1 ene 2016 año
23.974
+11.893
98.44%

Ranking de los países por los datos estadísticos actuales