33
/es/
AIzaSyAYiBZKx7MnpbEhh9jyipgxe19OcubqV5w
August 1, 2025
182321
Luxembourg
LUX
true
2
1
Merchandise exports by the reporting economy (current US$)
2015,2014,2013,2012,2011,2010,2009,2008,2007,2006,2005,2004,2003,2002,2001,2000,1999,1998
Download
Estadísticas Globales de la Biblioteca →Luxembourg →

Merchandise exports by the reporting economy (current US$)

Estas estadísticas en otros países:

AfghanistanAlbaniaAlgeriaAmerican SamoaAngolaAntigua and BarbudaArab WorldArgentinaArmeniaArubaAustraliaAustriaAzerbaijanBahamas, TheBahrainBangladeshBarbadosBelarusBelgiumBelizeBeninBermudaBoliviaBosnia and HerzegovinaBrazilBrunei DarussalamBulgariaBurkina FasoBurundiCabo VerdeCambodiaCameroonCanadaCaribbean small statesCentral African RepublicCentral Europe and the BalticsChadChileChinaColombiaComorosCongo, Dem. Rep.Congo, Rep.Costa RicaCote d'IvoireCroatiaCubaCyprusCzech RepublicDenmarkDjiboutiDominicaDominican RepublicEarly-demographic dividendEast Asia & PacificEast Asia & Pacific (excluding high income)East Asia & Pacific (IDA & IBRD countries)EcuadorEgypt, Arab Rep.El SalvadorEquatorial GuineaEstoniaEthiopiaEuro areaEurope & Central AsiaEurope & Central Asia (excluding high income)Europe & Central Asia (IDA & IBRD countries)European UnionFaroe IslandsFijiFinlandFragile and conflict affected situationsFranceFrench PolynesiaGabonGambia, TheGeorgiaGermanyGhanaGibraltarGreeceGreenlandGrenadaGuamGuatemalaGuineaGuinea-BissauGuyanaHaitiHeavily indebted poor countries (HIPC)High incomeHondurasHong Kong SAR, ChinaHungaryIBRD onlyIcelandIDA & IBRD totalIDA blendIDA onlyIDA totalIndiaIndonesiaIran, Islamic Rep.IraqIrelandIsraelItalyJamaicaJapanJordanKazakhstanKenyaKiribatiKorea, Dem. People’s Rep.Korea, Rep.KosovoKuwaitKyrgyz RepublicLao PDRLate-demographic dividendLatin America & Caribbean Latin America & Caribbean (excluding high income)Latin America & the Caribbean (IDA & IBRD countries)LatviaLeast developed countries: UN classificationLebanonLiberiaLibyaLithuaniaLow & middle incomeLow incomeLower middle incomeLuxembourgMacao SAR, ChinaMacedonia, FYRMadagascarMalawiMalaysiaMaldivesMaliMaltaMauritaniaMauritiusMexicoMiddle East & North AfricaMiddle East & North Africa (excluding high income)Middle East & North Africa (IDA & IBRD countries)Middle incomeMoldovaMongoliaMontenegroMoroccoMozambiqueMyanmarNauruNepalNetherlandsNew CaledoniaNew ZealandNicaraguaNigerNigeriaNorth AmericaNorwayOECD membersOmanOther small statesPacific island small statesPakistanPanamaPapua New GuineaParaguayPeruPhilippinesPolandPortugalPost-demographic dividendPre-demographic dividendQatarRomaniaRussian FederationRwandaSamoaSao Tome and PrincipeSaudi ArabiaSenegalSerbiaSeychellesSierra LeoneSingaporeSlovak RepublicSloveniaSmall statesSolomon IslandsSomaliaSouth AfricaSouth AsiaSouth Asia (IDA & IBRD)SpainSri LankaSt. Kitts and NevisSt. LuciaSt. Vincent and the GrenadinesSub-Saharan Africa Sub-Saharan Africa (excluding high income)Sub-Saharan Africa (IDA & IBRD countries)SudanSurinameSwedenSwitzerlandSyrian Arab RepublicTajikistanTanzaniaThailandTogoTongaTrinidad and TobagoTunisiaTurkeyTurkmenistanTuvaluUgandaUkraineUnited Arab EmiratesUnited KingdomUnited StatesUpper middle incomeUruguayUzbekistanVanuatuVenezuela, RBVietnamWorldYemen, Rep.ZambiaZimbabwe

línea de tiempo (timeline):

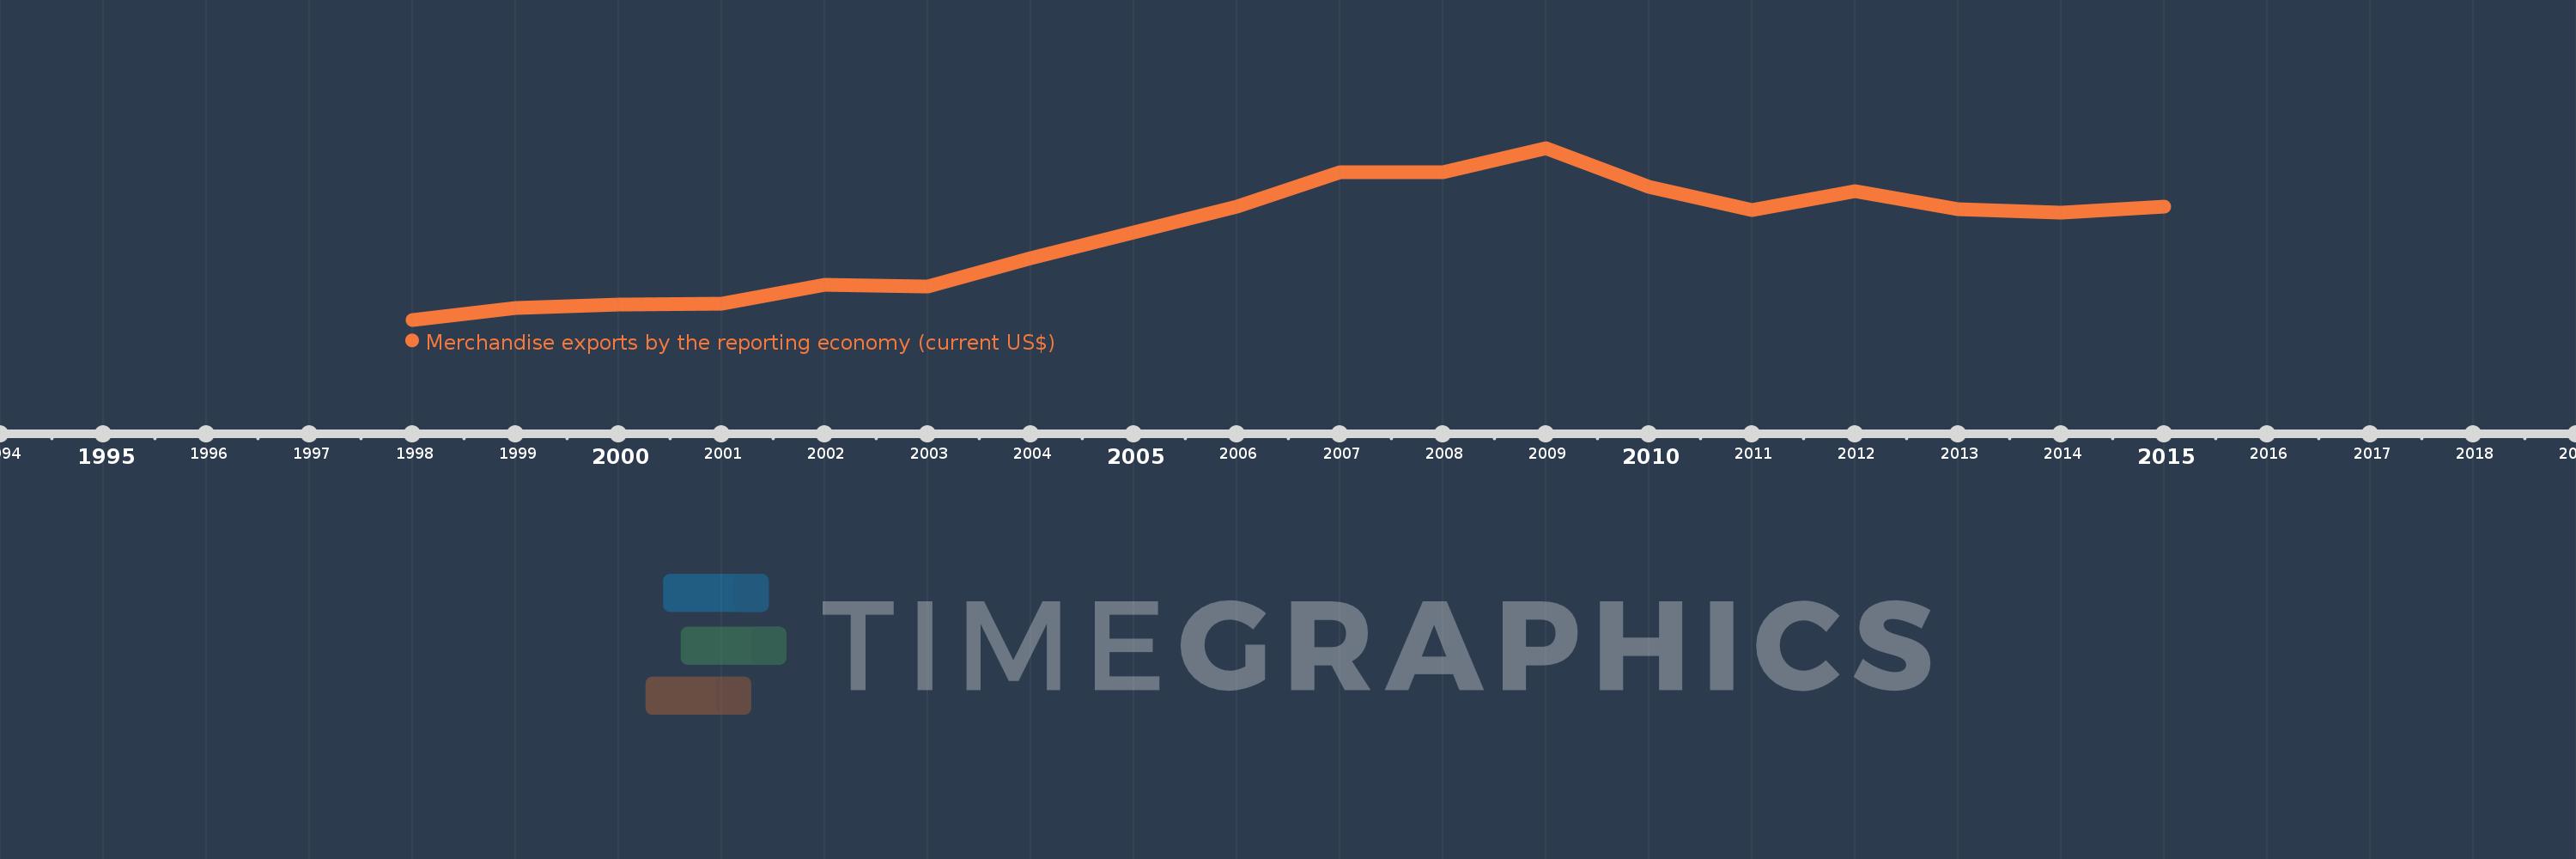
En esta escala de tiempo se presenta un gráfico de 1998 y 2015 de Luxembourg. Los datos de 1997 están ausentes. El número de observaciones reales por fecha: 18.

Fuente (nombre):

Indicadores del desarrollo mundial

Fuente (organización):

World Bank staff estimates based data from International Monetary Fund's Direction of Trade database.

Categorías:

Private Sector, Trade

Se ha actualizado:

23 abr 2017 año

Los indicadores de los cambios de valor en los últimos años

En promedio:
16.042 bn
Mínimo:
6.434 bn
1 ene 1998 año
Máximo:
25.691 bn
1 ene 2009 año
A la fecha de observación
Valor
Cambio absoluto
El cambio con respecto al valor anterior
1 ene 1998 año
6.434 bn
+6.434 bn
0.0%
1 ene 1999 año
7.743 bn
+1.309 bn
20.34%
1 ene 2000 año
8.177 bn
+434.438 millones
5.61%
1 ene 2001 año
8.245 bn
+67.475 millones
0.83%
1 ene 2002 año
10.321 bn
+2.076 bn
25.18%
1 ene 2003 año
10.191 bn
-130.563 millones
-1.26%
1 ene 2004 año
13.322 bn
+3.131 bn
30.73%
1 ene 2005 año
16.258 bn
+2.936 bn
22.04%
1 ene 2006 año
19.068 bn
+2.81 bn
17.29%
1 ene 2007 año
22.985 bn
+3.917 bn
20.54%
1 ene 2008 año
22.948 bn
-36.955 millones
-0.16%
1 ene 2009 año
25.691 bn
+2.743 bn
11.95%
1 ene 2010 año
21.321 bn
-4.371 bn
-17.01%
1 ene 2011 año
18.775 bn
-2.546 bn
-11.94%
1 ene 2012 año
20.815 bn
+2.04 bn
10.87%
1 ene 2013 año
18.866 bn
-1.949 bn
-9.36%
1 ene 2014 año
18.464 bn
-402.121 millones
-2.13%
1 ene 2015 año
19.125 bn
+660.456 millones
3.58%

Ranking de los países por los datos estadísticos actuales