30
/es/
AIzaSyAYiBZKx7MnpbEhh9jyipgxe19OcubqV5w
April 1, 2024
176469
Lebanon
LBN
true
2
1
Gross value added at factor cost (constant 2010 US$)
2016,2015,2014,2013,2012,2011,2010,2009,2008,2007,2006,2005,2004,2003,2002,2001,2000,1999,1998,1997,1996,1995
Download
Estadísticas Globales de la Biblioteca →Lebanon →

Gross value added at factor cost (constant 2010 US$)

Estas estadísticas en otros países:

AfghanistanAlbaniaAlgeriaAndorraAntigua and BarbudaArgentinaArmeniaArubaAustraliaAustriaAzerbaijanBahamas, TheBangladeshBarbadosBelarusBelgiumBelizeBeninBermudaBhutanBoliviaBosnia and HerzegovinaBotswanaBrazilBulgariaBurkina FasoBurundiCabo VerdeCambodiaCameroonCanadaCaribbean small statesCentral African RepublicCentral Europe and the BalticsChadChileColombiaCongo, Dem. Rep.Costa RicaCroatiaCubaCyprusCzech RepublicDenmarkDominicaDominican RepublicEarly-demographic dividendEcuadorEgypt, Arab Rep.El SalvadorEquatorial GuineaEstoniaEthiopiaEuro areaEurope & Central AsiaEurope & Central Asia (excluding high income)Europe & Central Asia (IDA & IBRD countries)European UnionFaroe IslandsFijiFinlandFranceGabonGambia, TheGeorgiaGermanyGhanaGreeceGrenadaGuatemalaGuineaGuinea-BissauGuyanaHeavily indebted poor countries (HIPC)High incomeHondurasHong Kong SAR, ChinaHungaryIcelandIDA blendIDA onlyIDA totalIndiaIndonesiaIran, Islamic Rep.IrelandItalyJamaicaJapanJordanKazakhstanKenyaKiribatiKorea, Rep.KosovoKuwaitKyrgyz RepublicLao PDRLatin America & Caribbean Latin America & Caribbean (excluding high income)Latin America & the Caribbean (IDA & IBRD countries)LatviaLeast developed countries: UN classificationLebanonLesothoLiechtensteinLithuaniaLow incomeLower middle incomeLuxembourgMacao SAR, ChinaMacedonia, FYRMadagascarMalawiMaldivesMaliMaltaMarshall IslandsMauritaniaMauritiusMexicoMicronesia, Fed. Sts.Middle East & North Africa (excluding high income)Middle East & North Africa (IDA & IBRD countries)MoldovaMongoliaMontenegroMoroccoMozambiqueNamibiaNepalNetherlandsNew ZealandNicaraguaNigeriaNorth AmericaNorwayOECD membersPacific island small statesPakistanPalauPanamaParaguayPeruPolandPortugalPost-demographic dividendPre-demographic dividendRomaniaRussian FederationRwandaSao Tome and PrincipeSenegalSerbiaSeychellesSierra LeoneSingaporeSlovak RepublicSloveniaSouth AfricaSouth AsiaSouth Asia (IDA & IBRD)SpainSri LankaSt. Kitts and NevisSt. LuciaSt. Vincent and the GrenadinesSub-Saharan Africa Sub-Saharan Africa (excluding high income)Sub-Saharan Africa (IDA & IBRD countries)SudanSurinameSwazilandSwedenSwitzerlandTajikistanTanzaniaThailandTimor-LesteTongaTrinidad and TobagoTunisiaTurkeyTurkmenistanTuvaluUgandaUkraineUnited KingdomUnited StatesUruguayUzbekistanVanuatuVenezuela, RBVietnamWest Bank and GazaWorldZambiaZimbabwe

línea de tiempo (timeline):

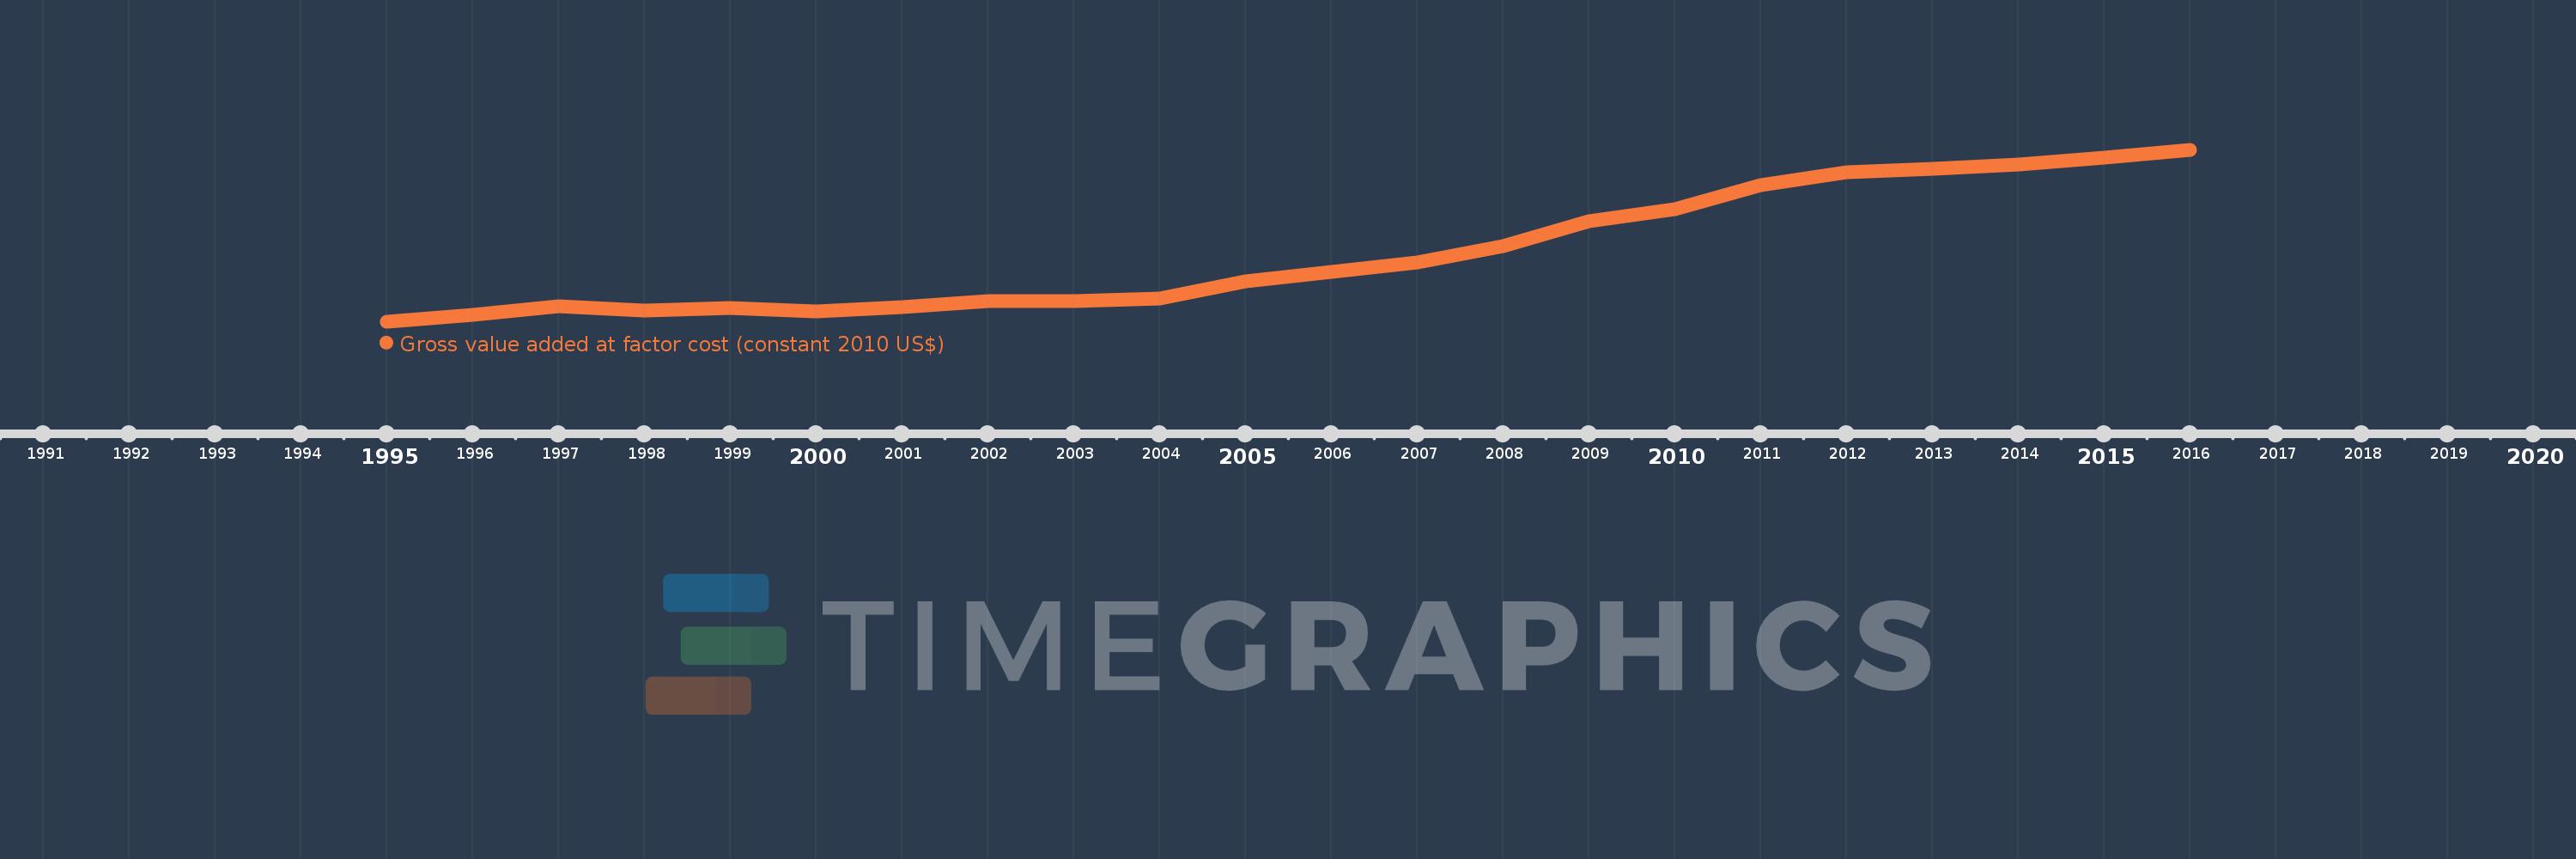
En esta escala de tiempo se presenta un gráfico de 1995 y 2016 de Lebanon. Los datos de 1994 están ausentes. El número de observaciones reales por fecha: 22.

Fuente (nombre):

Indicadores del desarrollo mundial

Fuente (organización):

World Bank national accounts data, and OECD National Accounts data files.

Categorías:

Economy & Growth

Se ha actualizado:

23 abr 2017 año

Los indicadores de los cambios de valor en los últimos años

En promedio:
25.775 bn
Mínimo:
17.4 bn
1 ene 1995 año
Máximo:
38.339 bn
1 ene 2016 año
A la fecha de observación
Valor
Cambio absoluto
El cambio con respecto al valor anterior
1 ene 1995 año
17.4 bn
+17.4 bn
0.0%
1 ene 1996 año
18.224 bn
+824.006 millones
4.74%
1 ene 1997 año
19.269 bn
+1.045 bn
5.74%
1 ene 1998 año
18.754 bn
-515.53 millones
-2.68%
1 ene 1999 año
19.104 bn
+350.929 millones
1.87%
1 ene 2000 año
18.67 bn
-434.934 millones
-2.28%
1 ene 2001 año
19.192 bn
+522.138 millones
2.8%
1 ene 2002 año
19.935 bn
+743.356 millones
3.87%
1 ene 2003 año
19.971 bn
+35.922 millones
0.18%
1 ene 2004 año
20.242 bn
+270.587 millones
1.35%
1 ene 2005 año
22.394 bn
+2.152 bn
10.63%
1 ene 2006 año
23.54 bn
+1.146 bn
5.12%
1 ene 2007 año
24.659 bn
+1.119 bn
4.75%
1 ene 2008 año
26.635 bn
+1.976 bn
8.01%
1 ene 2009 año
29.717 bn
+3.082 bn
11.57%
1 ene 2010 año
31.156 bn
+1.439 bn
4.84%
1 ene 2011 año
34.119 bn
+2.962 bn
9.51%
1 ene 2012 año
35.617 bn
+1.498 bn
4.39%
1 ene 2013 año
36.096 bn
+479.324 millones
1.35%
1 ene 2014 año
36.574 bn
+477.983 millones
1.32%
1 ene 2015 año
37.442 bn
+867.727 millones
2.37%
1 ene 2016 año
38.339 bn
+896.996 millones
2.4%

Ranking de los países por los datos estadísticos actuales