33
/es/
AIzaSyB4mHJ5NPEv-XzF7P6NDYXjlkCWaeKw5bc
November 1, 2025
173518
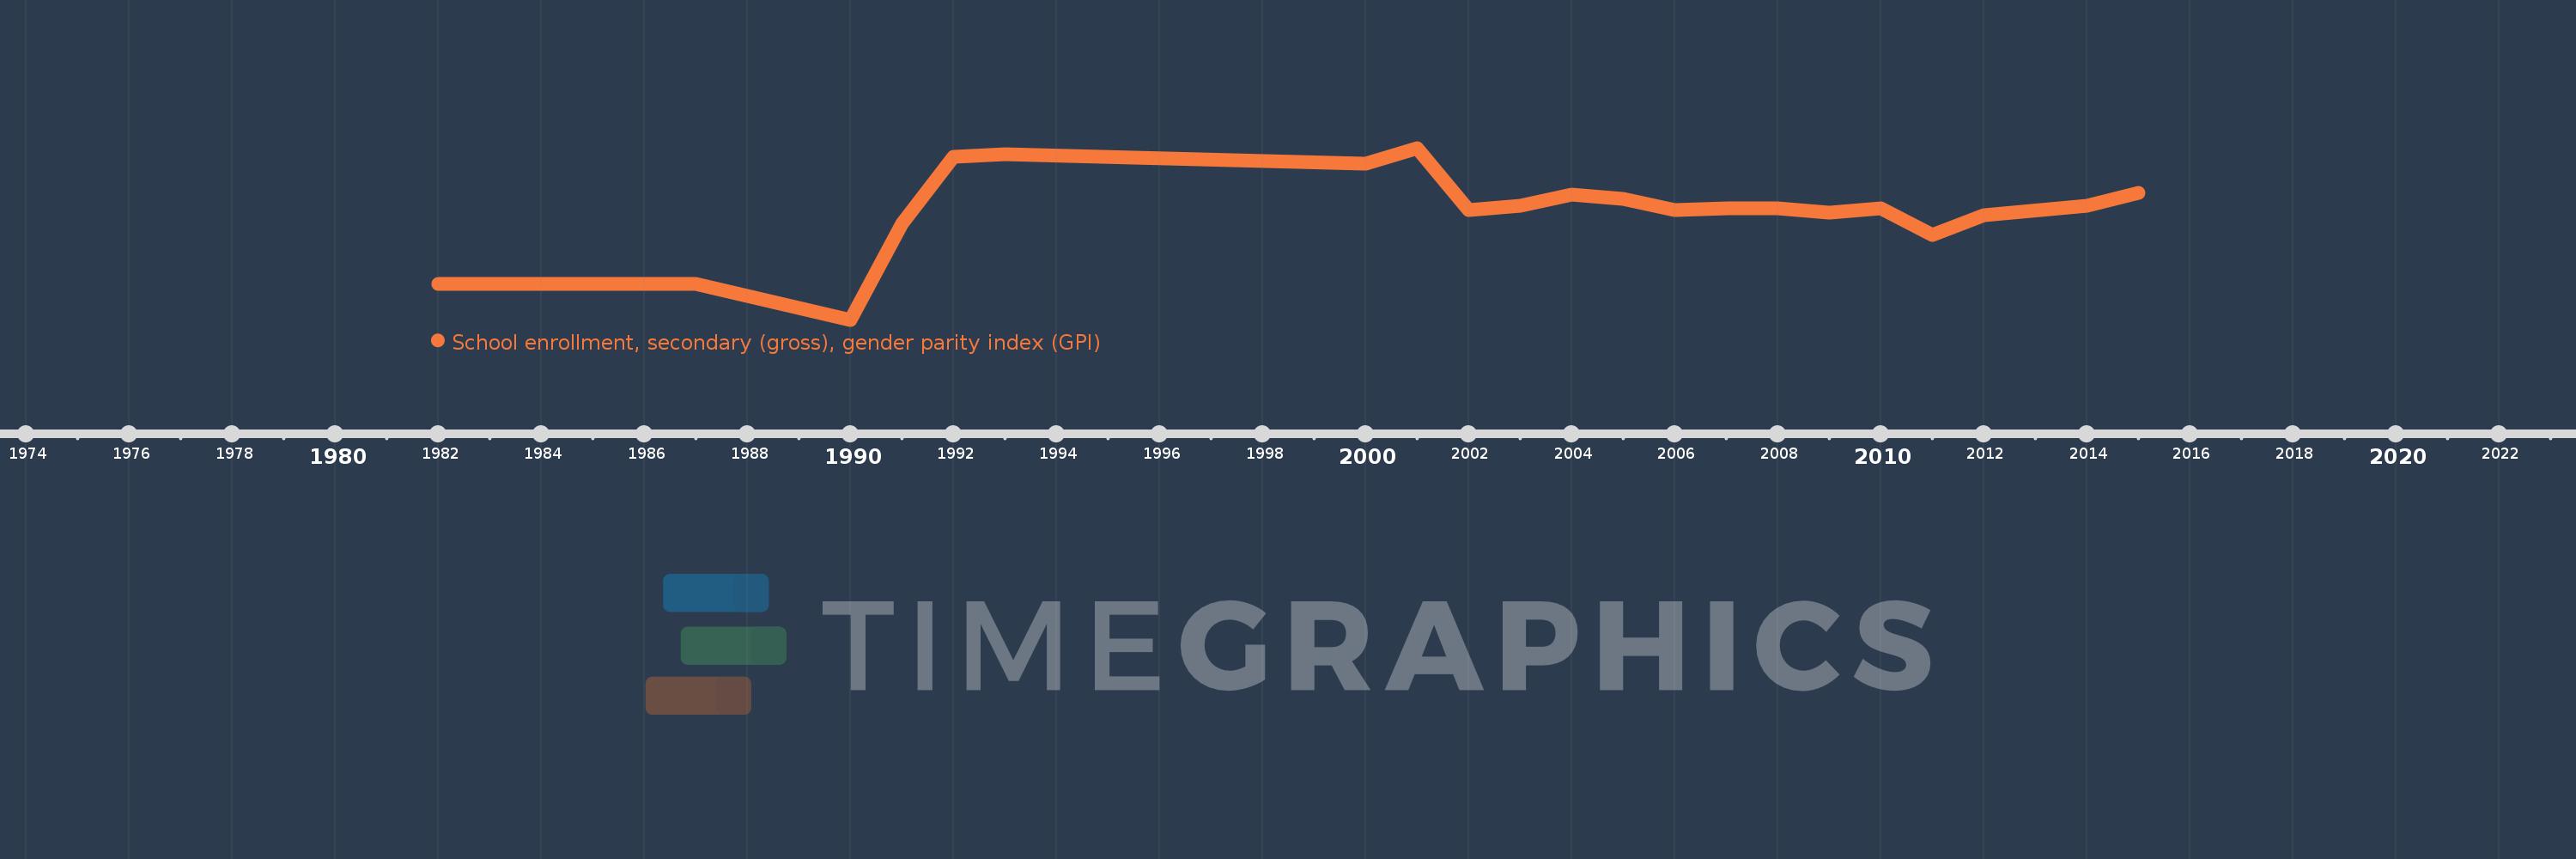
Kyrgyz Republic
KGZ
true
2
1
School enrollment, secondary (gross), gender parity index (GPI)
2015,2014,2012,2011,2010,2009,2008,2007,2006,2005,2004,2003,2002,2001,2000,1993,1992,1991,1990,1987,1982