33
/es/
AIzaSyAYiBZKx7MnpbEhh9jyipgxe19OcubqV5w
May 1, 2025
169670
Korea, Rep.
KOR
true
2
1
Bound rate, simple mean, all products (%)
2016,2015,2014,2013,2012,2011,2010,2009,2008,2007,2006,2005,2004,2003,2002,2001,2000,1997,1996
Download
Estadísticas Globales de la Biblioteca →Korea, Rep. →

Bound rate, simple mean, all products (%)

Estas estadísticas en otros países:

AlbaniaAngolaAntigua and BarbudaArgentinaArmeniaAustraliaAustriaBahrainBangladeshBarbadosBelgiumBelizeBeninBoliviaBotswanaBrazilBrunei DarussalamBulgariaBurkina FasoBurundiCabo VerdeCambodiaCameroonCanadaCentral African RepublicChadChileChinaColombiaCongo, Dem. Rep.Congo, Rep.Costa RicaCote d'IvoireCubaCyprusCzech RepublicDenmarkDjiboutiDominicaDominican RepublicEast Asia & Pacific (excluding high income)EcuadorEgypt, Arab Rep.El SalvadorEstoniaEurope & Central Asia (excluding high income)European UnionFijiFinlandFranceGabonGambia, TheGeorgiaGermanyGhanaGreeceGrenadaGuatemalaGuineaGuinea-BissauGuyanaHaitiHigh incomeHondurasHong Kong SAR, ChinaHungaryIcelandIndiaIndonesiaIrelandIsraelItalyJamaicaJapanJordanKenyaKorea, Rep.KuwaitKyrgyz RepublicLatin America & Caribbean (excluding high income)LatviaLesothoLithuaniaLow & middle incomeLow incomeLower middle incomeLuxembourgMacao SAR, ChinaMacedonia, FYRMadagascarMalawiMalaysiaMaldivesMaliMaltaMauritaniaMauritiusMexicoMiddle East & North Africa (excluding high income)Middle incomeMoldovaMongoliaMoroccoMozambiqueMyanmarNamibiaNepalNetherlandsNew ZealandNicaraguaNigerNigeriaNorwayOECD membersOmanPakistanPanamaPapua New GuineaParaguayPeruPhilippinesPolandPortugalQatarRomaniaRwandaSaudi ArabiaSenegalSierra LeoneSingaporeSlovak RepublicSloveniaSolomon IslandsSouth AfricaSouth AsiaSpainSri LankaSt. Kitts and NevisSt. LuciaSt. Vincent and the GrenadinesSub-Saharan Africa (excluding high income)SurinameSwazilandSwedenSwitzerlandTanzaniaThailandTogoTongaTrinidad and TobagoTunisiaTurkeyUgandaUkraineUnited Arab EmiratesUnited KingdomUnited StatesUpper middle incomeUruguayVenezuela, RBVietnamWorldZambiaZimbabwe

línea de tiempo (timeline):

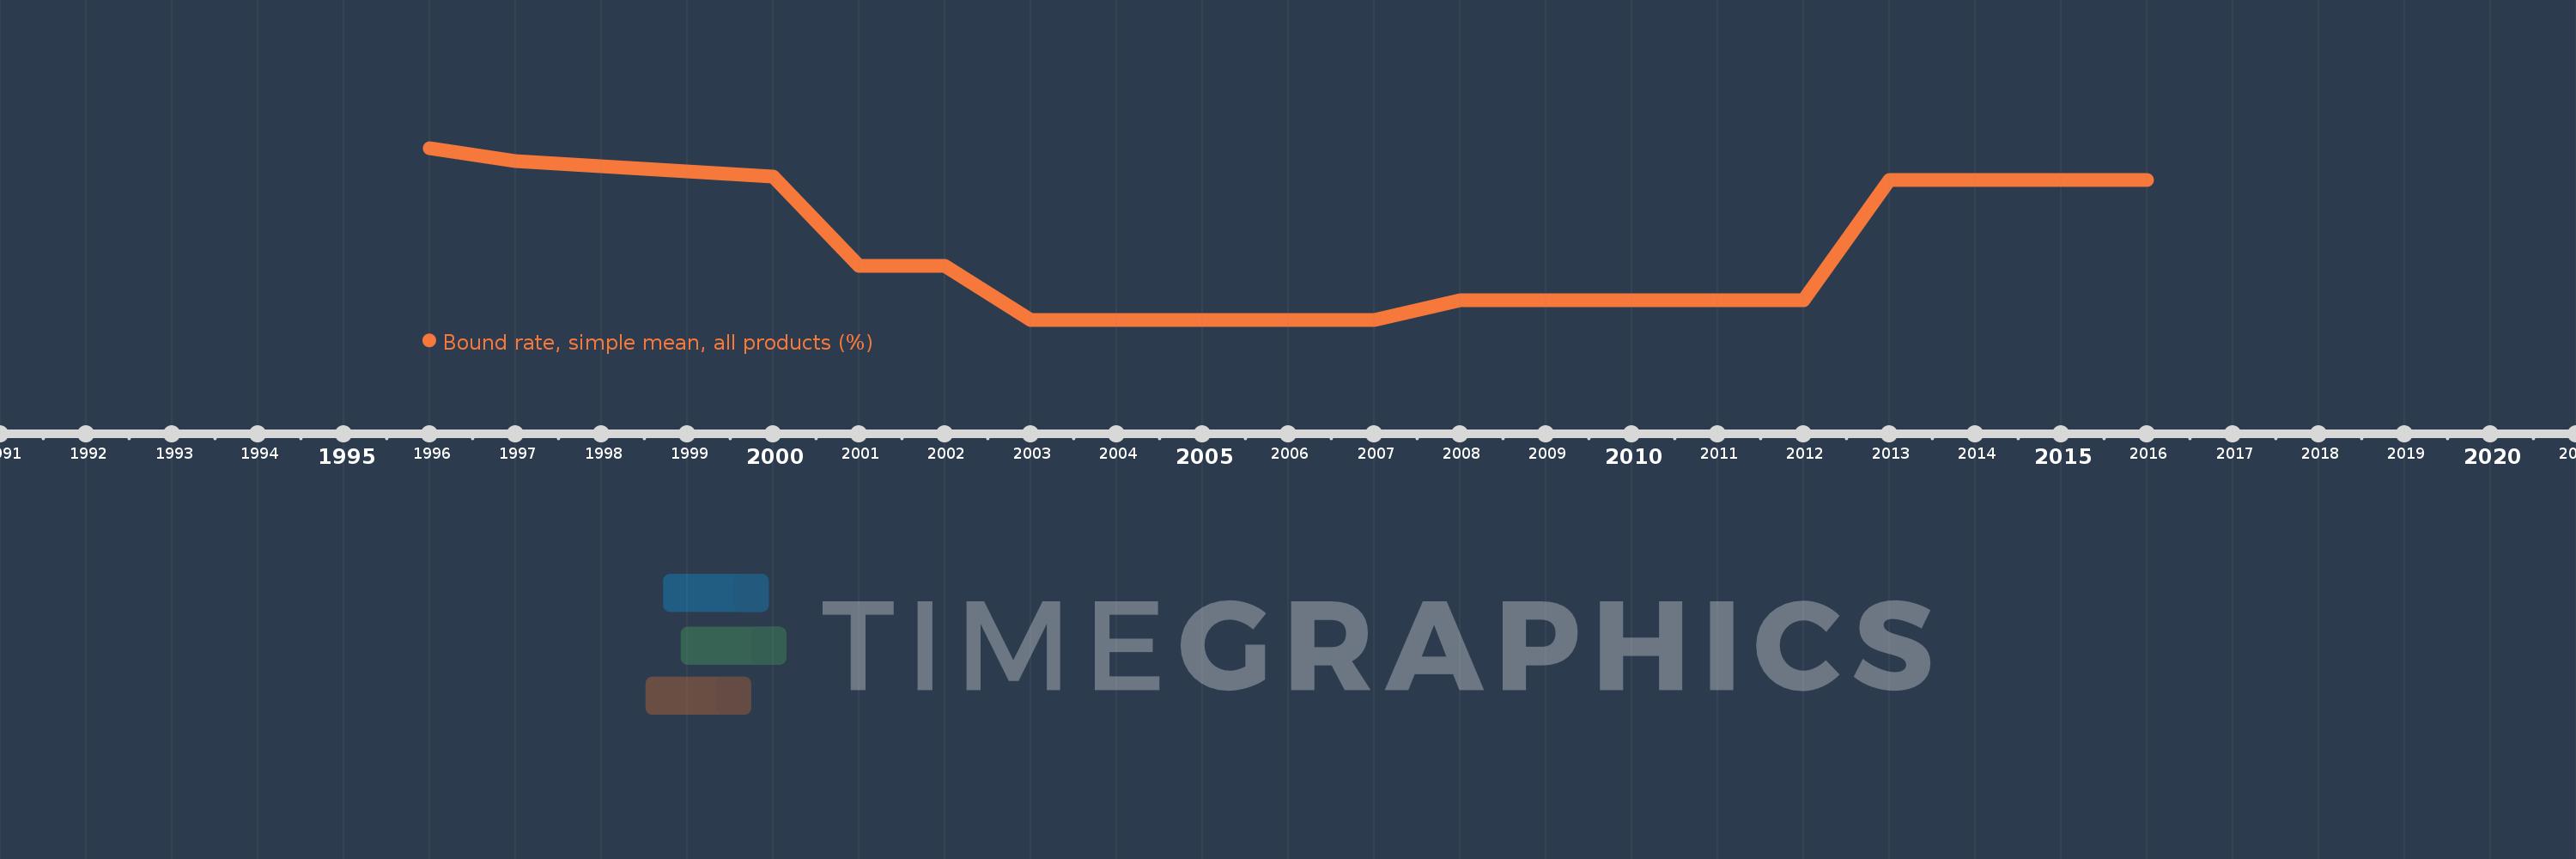
En esta escala de tiempo se presenta un gráfico de 1996 y 2016 de Korea, Rep.. Los datos de 1995 están ausentes. El número de observaciones reales por fecha: 19.

Fuente (nombre):

Indicadores del desarrollo mundial

Fuente (organización):

World Bank staff estimates using the World Integrated Trade Solution system, based on data from World Trade Organization.

Categorías:

Private Sector, Trade

Se ha actualizado:

23 abr 2017 año

Los indicadores de los cambios de valor en los últimos años

En promedio:
16.142
Mínimo:
15.61
1 ene 2003 año
Máximo:
17.01
1 ene 1996 año
A la fecha de observación
Valor
Cambio absoluto
El cambio con respecto al valor anterior
1 ene 1996 año
17.01
+17.01
0.0%
1 ene 1997 año
16.9
-0.11
-0.65%
1 ene 2000 año
16.78
-0.12
-0.71%
1 ene 2001 año
16.05
-0.73
-4.35%
1 ene 2002 año
16.05
0.0
0.0%
1 ene 2003 año
15.61
-0.44
-2.74%
1 ene 2004 año
15.61
0.0
0.0%
1 ene 2005 año
15.61
0.0
0.0%
1 ene 2006 año
15.61
0.0
0.0%
1 ene 2007 año
15.61
0.0
0.0%
1 ene 2008 año
15.77
+0.16
1.02%
1 ene 2009 año
15.77
0.0
0.0%
1 ene 2010 año
15.77
0.0
0.0%
1 ene 2011 año
15.77
0.0
0.0%
1 ene 2012 año
15.77
0.0
0.0%
1 ene 2013 año
16.75
+0.98
6.21%
1 ene 2014 año
16.75
0.0
0.0%
1 ene 2015 año
16.75
0.0
0.0%
1 ene 2016 año
16.75
0.0
0.0%

Ranking de los países por los datos estadísticos actuales