29
/es/
es
AIzaSyAYiBZKx7MnpbEhh9jyipgxe19OcubqV5w
April 1, 2024
166077
Kazakhstan
KAZ
true
2
1
Exports of goods and services (current US$)
2016,2015,2014,2013,2012,2011,2010,2009,2008,2007,2006,2005,2004,2003,2002,2001,2000,1999,1998,1997,1996,1995,1994,1993
Download
Estadísticas Globales de la Biblioteca →Kazakhstan →

Exports of goods and services (current US$)

Estas estadísticas en otros países:
AfghanistanAlbaniaAlgeriaAngolaAntigua and BarbudaArab WorldArgentinaArmeniaArubaAustraliaAustriaAzerbaijanBahamas, TheBahrainBangladeshBarbadosBelarusBelgiumBelizeBeninBermudaBhutanBoliviaBosnia and HerzegovinaBotswanaBrazilBrunei DarussalamBulgariaBurkina FasoBurundiCabo VerdeCambodiaCameroonCanadaCaribbean small statesCentral African RepublicCentral Europe and the BalticsChadChileChinaColombiaComorosCongo, Dem. Rep.Congo, Rep.Costa RicaCote d'IvoireCroatiaCubaCyprusCzech RepublicDenmarkDjiboutiDominicaDominican RepublicEarly-demographic dividendEast Asia & PacificEast Asia & Pacific (excluding high income)East Asia & Pacific (IDA & IBRD countries)EcuadorEgypt, Arab Rep.El SalvadorEquatorial GuineaEritreaEstoniaEthiopiaEuro areaEurope & Central AsiaEurope & Central Asia (excluding high income)Europe & Central Asia (IDA & IBRD countries)European UnionFaroe IslandsFijiFinlandFragile and conflict affected situationsFranceFrench PolynesiaGabonGambia, TheGeorgiaGermanyGhanaGreeceGrenadaGuatemalaGuineaGuinea-BissauGuyanaHaitiHeavily indebted poor countries (HIPC)High incomeHondurasHong Kong SAR, ChinaHungaryIBRD onlyIcelandIDA & IBRD totalIDA blendIDA onlyIDA totalIndiaIndonesiaIran, Islamic Rep.IraqIrelandIsraelItalyJamaicaJapanJordanKazakhstanKenyaKiribatiKorea, Rep.KosovoKuwaitKyrgyz RepublicLao PDRLate-demographic dividendLatin America & Caribbean Latin America & Caribbean (excluding high income)Latin America & the Caribbean (IDA & IBRD countries)LatviaLeast developed countries: UN classificationLebanonLesothoLiberiaLibyaLithuaniaLow & middle incomeLow incomeLower middle incomeLuxembourgMacao SAR, ChinaMacedonia, FYRMadagascarMalawiMalaysiaMaldivesMaliMaltaMauritaniaMauritiusMexicoMicronesia, Fed. Sts.Middle East & North AfricaMiddle East & North Africa (excluding high income)Middle East & North Africa (IDA & IBRD countries)Middle incomeMoldovaMongoliaMontenegroMoroccoMozambiqueMyanmarNamibiaNepalNetherlandsNew CaledoniaNew ZealandNicaraguaNigerNigeriaNorth AmericaNorwayOECD membersOmanOther small statesPacific island small statesPakistanPalauPanamaPapua New GuineaParaguayPeruPhilippinesPolandPortugalPost-demographic dividendPre-demographic dividendPuerto RicoQatarRomaniaRussian FederationRwandaSamoaSaudi ArabiaSenegalSerbiaSeychellesSierra LeoneSingaporeSlovak RepublicSloveniaSmall statesSolomon IslandsSomaliaSouth AfricaSouth AsiaSouth Asia (IDA & IBRD)South SudanSpainSri LankaSt. Kitts and NevisSt. LuciaSt. Vincent and the GrenadinesSub-Saharan Africa Sub-Saharan Africa (excluding high income)Sub-Saharan Africa (IDA & IBRD countries)SudanSurinameSwazilandSwedenSwitzerlandSyrian Arab RepublicTajikistanTanzaniaThailandTimor-LesteTogoTongaTrinidad and TobagoTunisiaTurkeyTurkmenistanUgandaUkraineUnited Arab EmiratesUnited KingdomUnited StatesUpper middle incomeUruguayUzbekistanVanuatuVenezuela, RBVietnamWest Bank and GazaWorldYemen, Rep.ZambiaZimbabwe
línea de tiempo (timeline):
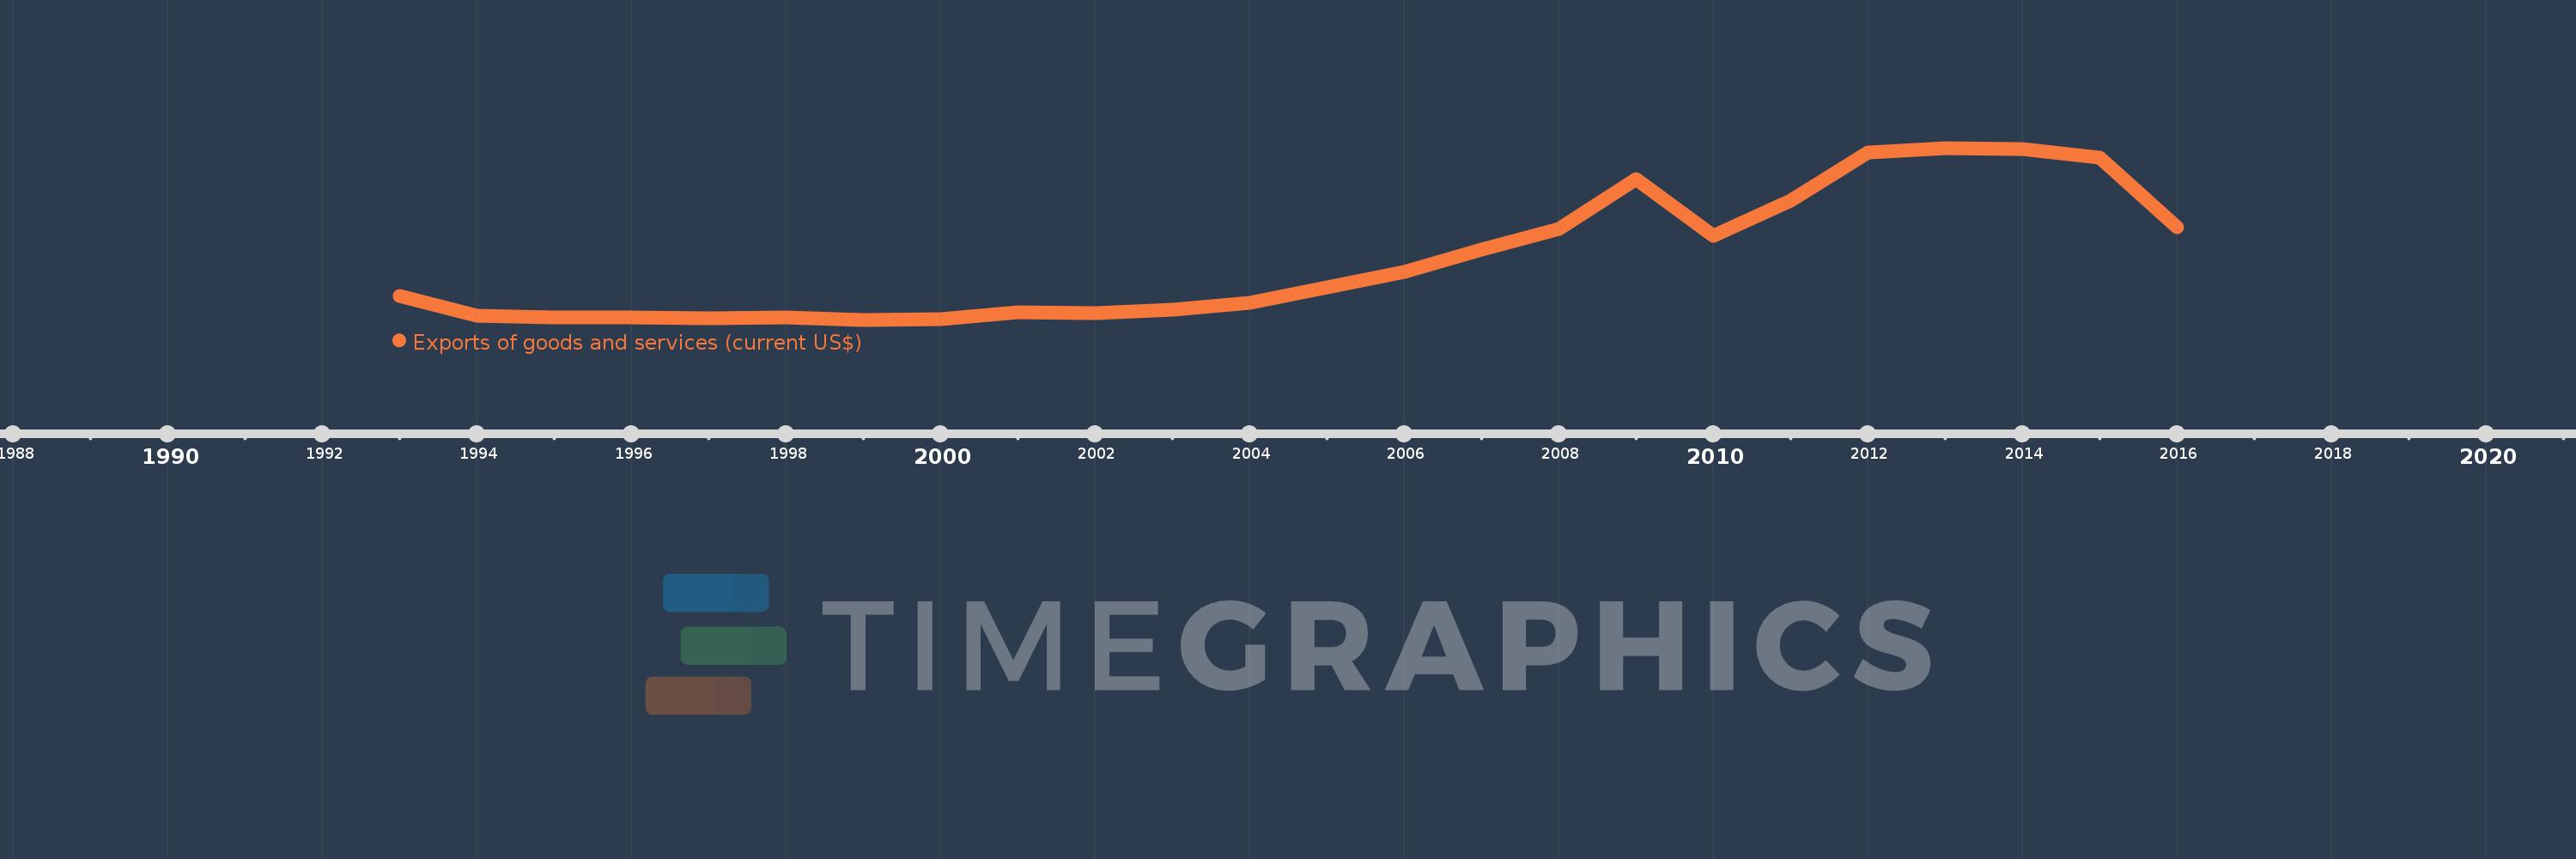
En esta escala de tiempo se presenta un gráfico de 1993 y 2016 de Kazakhstan. Los datos de 1992 están ausentes. El número de observaciones reales por fecha: 24.
Fuente (nombre):
Indicadores del desarrollo mundial
Fuente (organización):
World Bank national accounts data, and OECD National Accounts data files.
Categorías:
Economy & Growth, Trade
Se ha actualizado:
23 abr 2017 año
Los indicadores de los cambios de valor en los últimos años
En promedio:
36.143 bn
Mínimo:
6.717 bn
1 ene 1999 año
Máximo:
91.747 bn
1 ene 2013 año
A la fecha de observación
Valor
Cambio absoluto
El cambio con respecto al valor anterior
1 ene 1993 año
18.432 bn
+18.432 bn
0.0%
1 ene 1994 año
8.871 bn
-9.561 bn
-51.87%
1 ene 1995 año
7.877 bn
-994.376 millones
-11.21%
1 ene 1996 año
7.941 bn
+64.086 millones
0.81%
1 ene 1997 año
7.419 bn
-521.735 millones
-6.57%
1 ene 1998 año
7.74 bn
+320.727 millones
4.32%
1 ene 1999 año
6.717 bn
-1.023 bn
-13.22%
1 ene 2000 año
7.164 bn
+446.939 millones
6.65%
1 ene 2001 año
10.354 bn
+3.19 bn
44.53%
1 ene 2002 año
10.167 bn
-186.73 millones
-1.8%
1 ene 2003 año
11.577 bn
+1.41 bn
13.87%
1 ene 2004 año
14.929 bn
+3.352 bn
28.95%
1 ene 2005 año
22.655 bn
+7.726 bn
51.75%
1 ene 2006 año
30.387 bn
+7.732 bn
34.13%
1 ene 2007 año
41.292 bn
+10.905 bn
35.89%
1 ene 2008 año
51.704 bn
+10.412 bn
25.22%
1 ene 2009 año
76.257 bn
+24.553 bn
47.49%
1 ene 2010 año
48.243 bn
-28.014 bn
-36.74%
1 ene 2011 año
65.502 bn
+17.259 bn
35.77%
1 ene 2012 año
89.503 bn
+24.001 bn
36.64%
1 ene 2013 año
91.747 bn
+2.244 bn
2.51%
1 ene 2014 año
91.381 bn
-366.214 millones
-0.4%
1 ene 2015 año
87.109 bn
-4.272 bn
-4.68%
1 ene 2016 año
52.47 bn
-34.639 bn
-39.76%
Ranking de los países por los datos estadísticos actuales

Comentarios:

Enviar
PremiumAbout & FeedbackAcuerdoPrivacidad
logo
© 2022 Selected Technologies LLC – Morgan Hill, California