33
/es/
AIzaSyB4mHJ5NPEv-XzF7P6NDYXjlkCWaeKw5bc
November 30, 2025
166054
Kazakhstan
KAZ
true
2
1
Energy imports, net (% of energy use)
2014,2013,2012,2011,2010,2009,2008,2007,2006,2005,2004,2003,2002,2001,2000,1999,1998,1997,1996,1995,1994,1993,1992,1991
Create a timeline
Public Timelines
For education
For educational institutions
For teachers
For students
Cabinet
For educational institutions
For teachers
For students
Open cabinet
FAQ
Close
Create a timeline
Public timelines
FAQ
About & Feedback
Acuerdo
Privacidad
FAQ
Support 24/7
Cabinet
Get premium
Donate
Download
Estadísticas Globales de la Biblioteca
→
Kazakhstan
→
Energy imports, net (% of energy use)
Estas estadísticas en otros países:
Albania
Algeria
Angola
Arab World
Argentina
Armenia
Australia
Austria
Azerbaijan
Bahrain
Bangladesh
Belarus
Belgium
Benin
Bolivia
Bosnia and Herzegovina
Botswana
Brazil
Brunei Darussalam
Bulgaria
Cambodia
Cameroon
Canada
Caribbean small states
Central Europe and the Baltics
Chile
China
Colombia
Congo, Dem. Rep.
Congo, Rep.
Costa Rica
Cote d'Ivoire
Croatia
Cuba
Curacao
Cyprus
Czech Republic
Denmark
Dominican Republic
Early-demographic dividend
East Asia & Pacific
East Asia & Pacific (excluding high income)
East Asia & Pacific (IDA & IBRD countries)
Ecuador
Egypt, Arab Rep.
El Salvador
Eritrea
Estonia
Ethiopia
Euro area
Europe & Central Asia
Europe & Central Asia (excluding high income)
Europe & Central Asia (IDA & IBRD countries)
European Union
Finland
Fragile and conflict affected situations
France
Gabon
Georgia
Germany
Ghana
Gibraltar
Greece
Guatemala
Haiti
Heavily indebted poor countries (HIPC)
High income
Honduras
Hong Kong SAR, China
Hungary
IBRD only
Iceland
IDA & IBRD total
IDA blend
IDA only
IDA total
India
Indonesia
Iran, Islamic Rep.
Iraq
Ireland
Israel
Italy
Jamaica
Japan
Jordan
Kazakhstan
Kenya
Korea, Dem. People’s Rep.
Korea, Rep.
Kosovo
Kuwait
Kyrgyz Republic
Late-demographic dividend
Latin America & Caribbean
Latin America & Caribbean (excluding high income)
Latin America & the Caribbean (IDA & IBRD countries)
Latvia
Least developed countries: UN classification
Lebanon
Libya
Lithuania
Low & middle income
Low income
Lower middle income
Luxembourg
Macedonia, FYR
Malaysia
Malta
Mauritius
Mexico
Middle East & North Africa
Middle East & North Africa (excluding high income)
Middle East & North Africa (IDA & IBRD countries)
Middle income
Moldova
Mongolia
Montenegro
Morocco
Mozambique
Myanmar
Namibia
Nepal
Netherlands
New Zealand
Nicaragua
Niger
Nigeria
North America
Norway
OECD members
Oman
Other small states
Pakistan
Panama
Paraguay
Peru
Philippines
Poland
Portugal
Post-demographic dividend
Pre-demographic dividend
Qatar
Romania
Russian Federation
Saudi Arabia
Senegal
Serbia
Singapore
Slovak Republic
Slovenia
Small states
South Africa
South Asia
South Asia (IDA & IBRD)
South Sudan
Spain
Sri Lanka
Sub-Saharan Africa
Sub-Saharan Africa (excluding high income)
Sub-Saharan Africa (IDA & IBRD countries)
Sudan
Sweden
Switzerland
Syrian Arab Republic
Tajikistan
Tanzania
Thailand
Togo
Trinidad and Tobago
Tunisia
Turkey
Turkmenistan
Ukraine
United Arab Emirates
United Kingdom
United States
Upper middle income
Uruguay
Uzbekistan
Venezuela, RB
Vietnam
World
Yemen, Rep.
Zambia
Zimbabwe
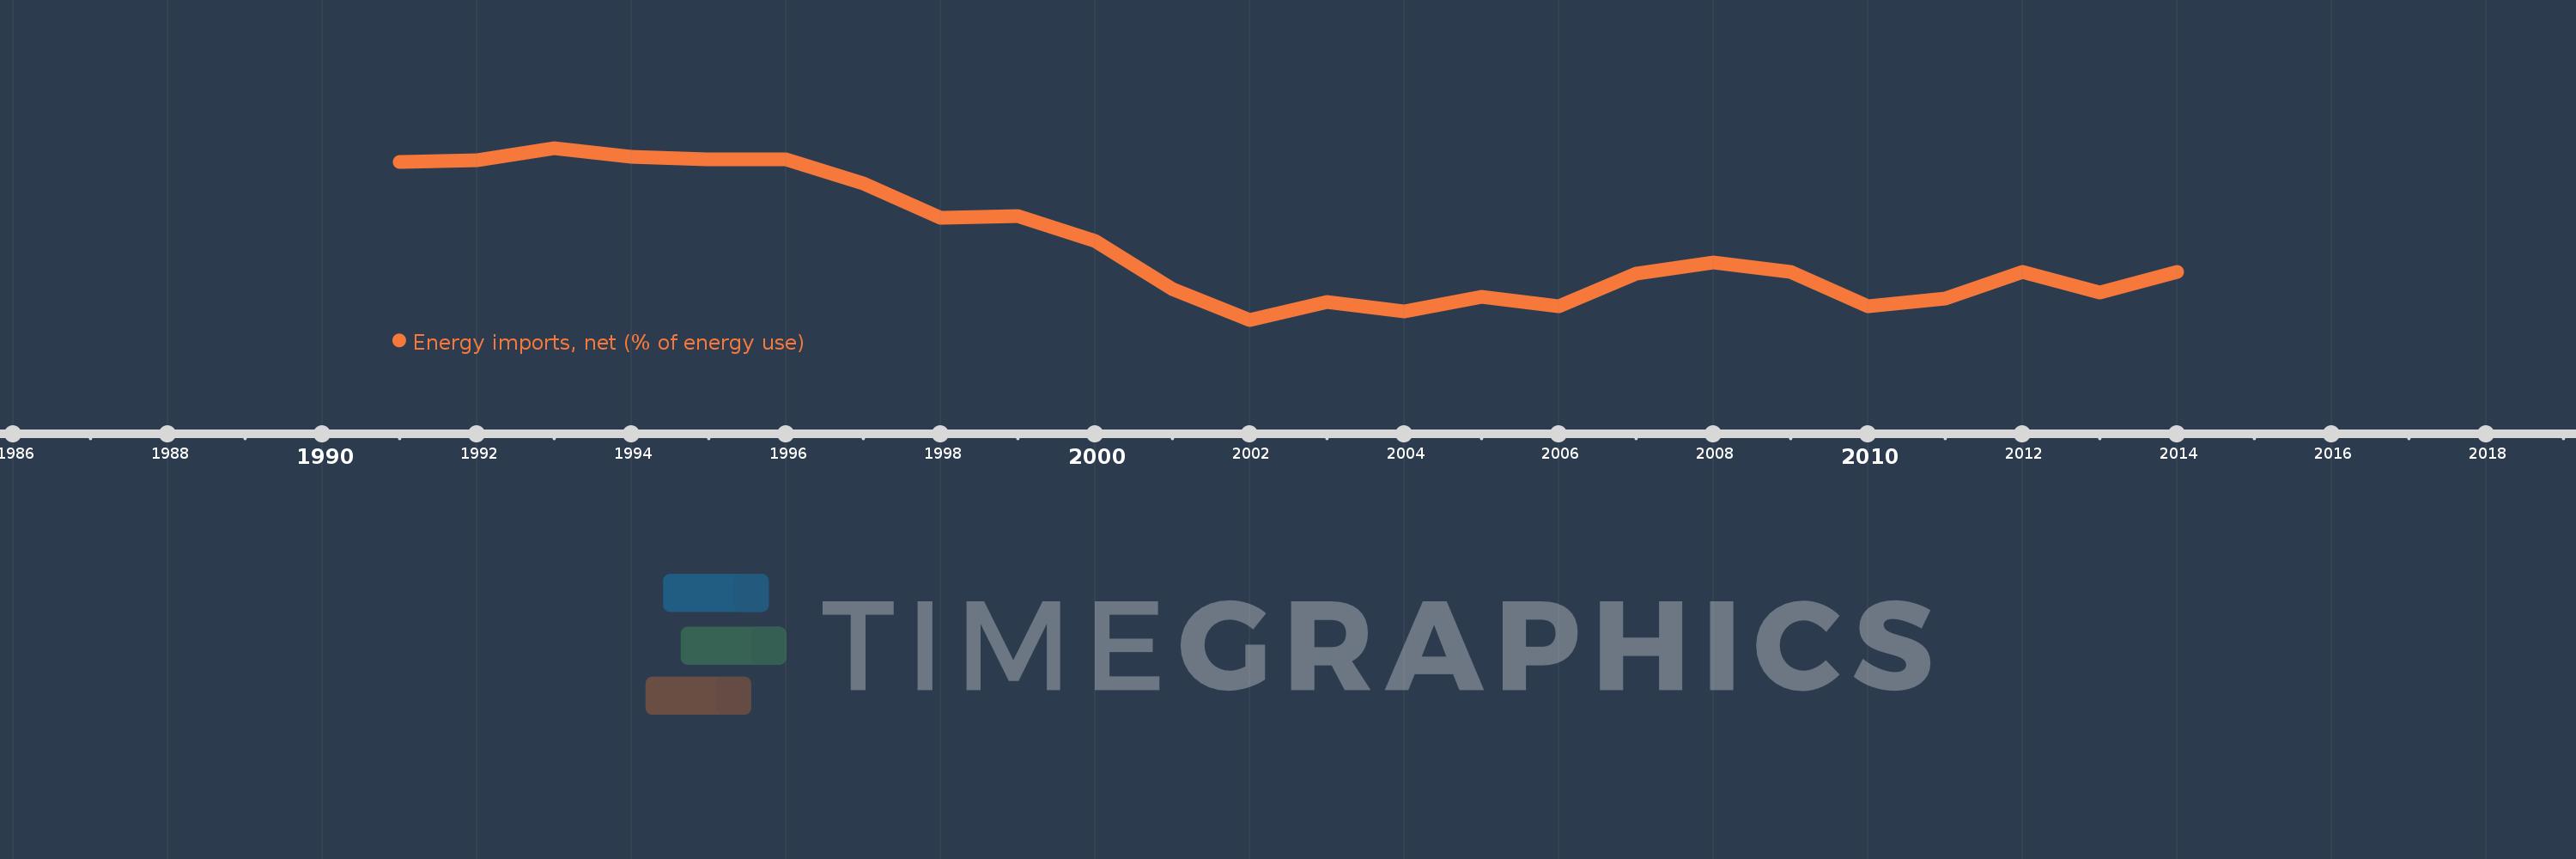
línea de tiempo (timeline):
En esta escala de tiempo se presenta un gráfico de
1991
y
2014
de Kazakhstan. Los datos de
1990
están ausentes. El número de observaciones reales por fecha:
24
.
Fuente (nombre):
Indicadores del desarrollo mundial
Fuente (organización):
IEA Statistics © OECD/IEA 2014 (http://www.iea.org/stats/index.asp), subject to https://www.iea.org/t&c/termsandconditions/
Categorías:
Energy & Mining, Trade
Se ha actualizado:
23 abr 2017 año
Los indicadores de los cambios de valor en los últimos años
En promedio:
-86.729
Mínimo:
-143.204
1 ene 2002 año
Máximo:
-13.535
1 ene 1993 año
A la fecha de observación
Valor
Cambio absoluto
El cambio con respecto al valor anterior
1 ene 1991 año
-23.861
-23.861
0.0%
1 ene 1992 año
-22.582
+1.279
-5.36%
1 ene 1993 año
-13.535
+9.047
-40.06%
1 ene 1994 año
-20.218
-6.683
49.37%
1 ene 1995 año
-22.461
-2.242
11.09%
1 ene 1996 año
-22.216
+0.245
-1.09%
1 ene 1997 año
-40.476
-18.26
82.19%
1 ene 1998 año
-65.979
-25.502
63.01%
1 ene 1999 año
-64.752
+1.226
-1.86%
1 ene 2000 año
-84.073
-19.321
29.84%
1 ene 2001 año
-120.228
-36.154
43.0%
1 ene 2002 año
-143.204
-22.976
19.11%
1 ene 2003 año
-129.667
+13.537
-9.45%
1 ene 2004 año
-136.597
-6.93
5.34%
1 ene 2005 año
-125.824
+10.773
-7.89%
1 ene 2006 año
-133.191
-7.367
5.86%
1 ene 2007 año
-108.155
+25.036
-18.8%
1 ene 2008 año
-100.044
+8.111
-7.5%
1 ene 2009 año
-106.775
-6.731
6.73%
1 ene 2010 año
-133.242
-26.467
24.79%
1 ene 2011 año
-126.958
+6.284
-4.72%
1 ene 2012 año
-107.235
+19.723
-15.54%
1 ene 2013 año
-122.883
-15.648
14.59%
1 ene 2014 año
-107.342
+15.541
-12.65%
Ranking de los países por los datos estadísticos actuales
About & Feedback
Acuerdo
Privacidad
FAQ
Support 24/7
Cabinet
Get premium
Donate
The service accepts bank transfer (ACH, Wire) or cards (Visa, MasterCard, etc). Processed by Stripe.
Secured with SSL