33
/es/
AIzaSyB4mHJ5NPEv-XzF7P6NDYXjlkCWaeKw5bc
November 1, 2025
160055
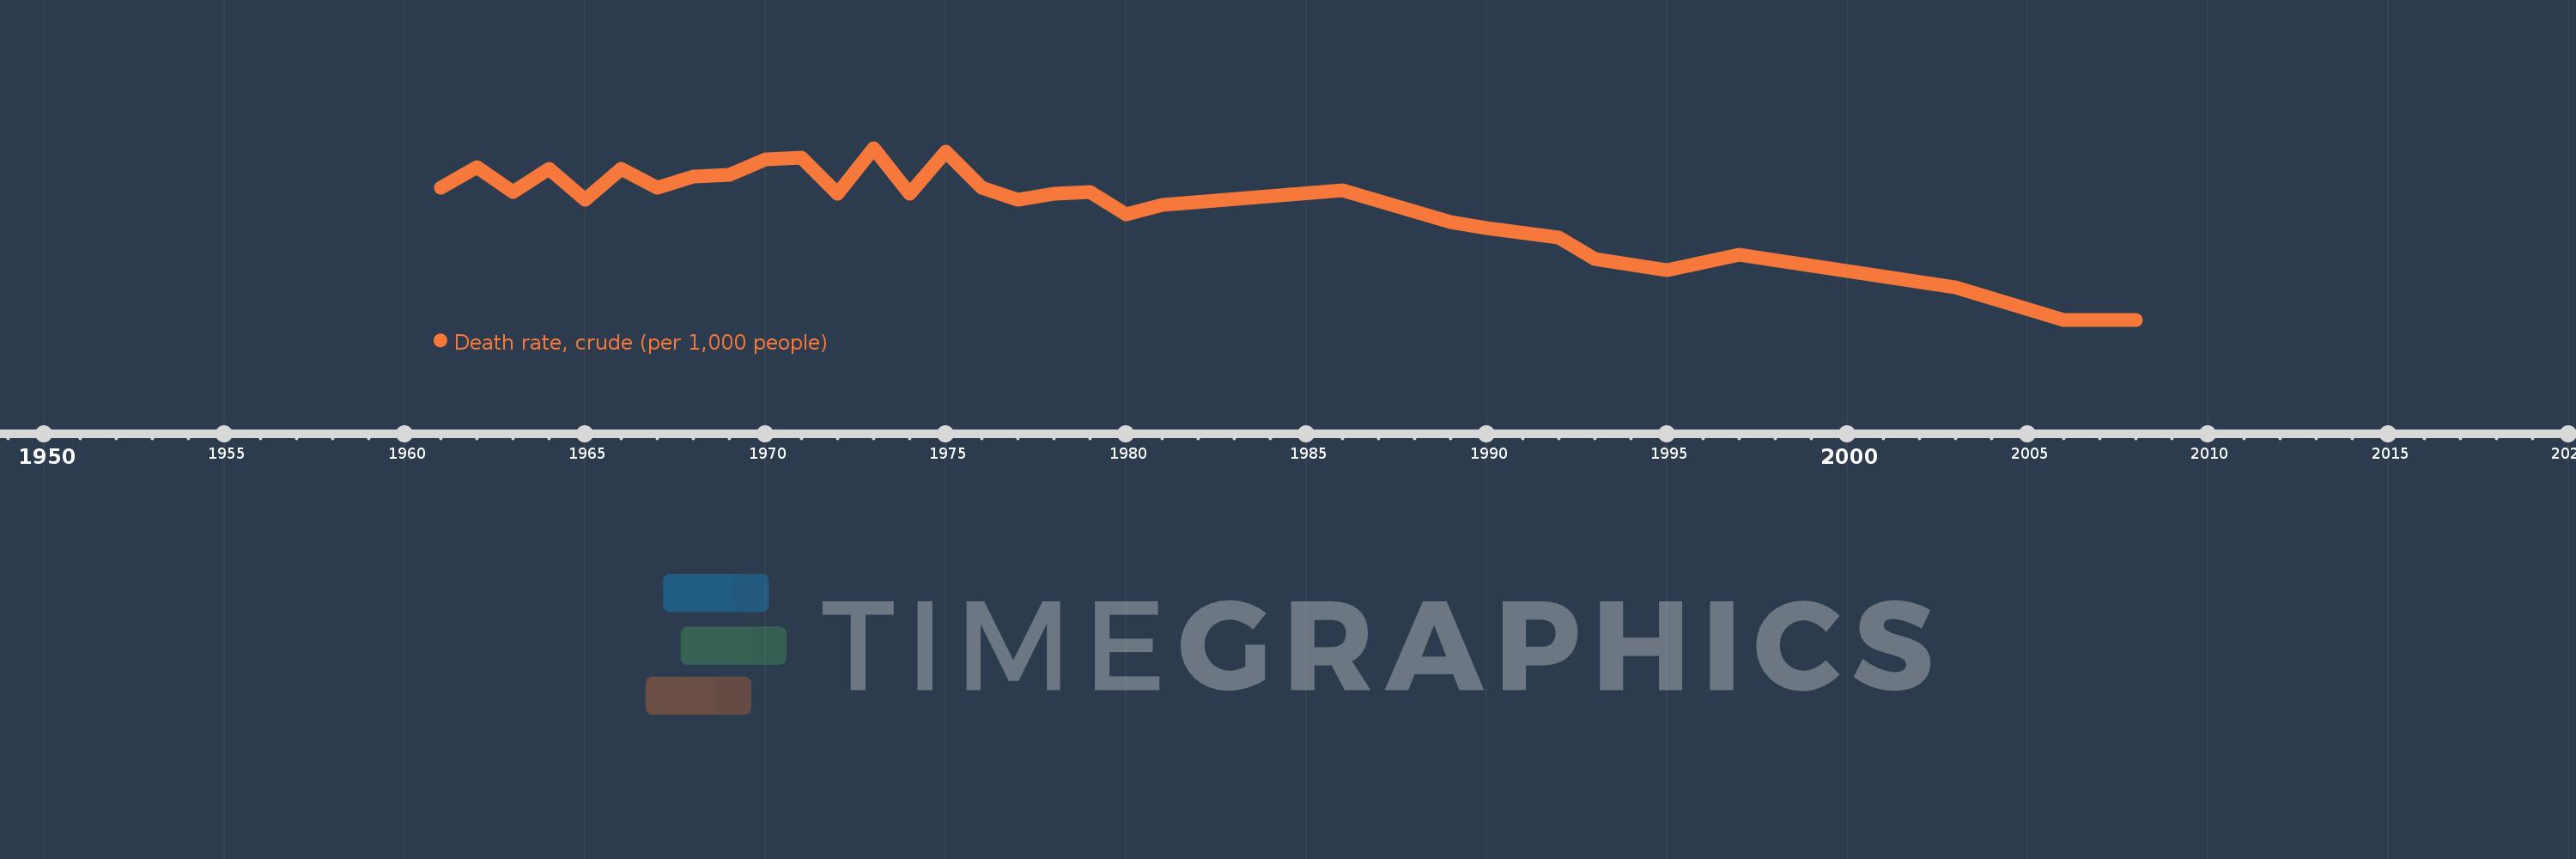
Isle of Man
IMN
true
2
1
Death rate, crude (per 1,000 people)
2008,2006,2003,1997,1995,1993,1992,1990,1989,1986,1981,1980,1979,1978,1977,1976,1975,1974,1973,1972,1971,1970,1969,1968,1967,1966,1965,1964,1963,1962,1961