29
/es/
es
AIzaSyAYiBZKx7MnpbEhh9jyipgxe19OcubqV5w
April 1, 2024
157710
Iran, Islamic Rep.
IRN
true
2
1
Number of maternal deaths
2016,2015,2014,2013,2012,2011,2010,2009,2008,2007,2006,2005,2004,2003,2002,2001,2000,1999,1998,1997,1996,1995,1994,1993,1992,1991
Download
Estadísticas Globales de la Biblioteca →Iran, Islamic Rep. →

Number of maternal deaths

Estas estadísticas en otros países:
AfghanistanAlbaniaAlgeriaAngolaArab WorldArgentinaArmeniaAustraliaAustriaAzerbaijanBahamas, TheBahrainBangladeshBarbadosBelarusBelgiumBelizeBeninBhutanBoliviaBosnia and HerzegovinaBotswanaBrazilBrunei DarussalamBulgariaBurkina FasoBurundiCabo VerdeCambodiaCameroonCanadaCaribbean small statesCentral African RepublicCentral Europe and the BalticsChadChileChinaColombiaComorosCongo, Dem. Rep.Congo, Rep.Costa RicaCote d'IvoireCroatiaCubaCyprusCzech RepublicDenmarkDjiboutiDominican RepublicEarly-demographic dividendEast Asia & PacificEast Asia & Pacific (excluding high income)East Asia & Pacific (IDA & IBRD countries)EcuadorEgypt, Arab Rep.El SalvadorEquatorial GuineaEritreaEstoniaEthiopiaEuro areaEurope & Central AsiaEurope & Central Asia (excluding high income)Europe & Central Asia (IDA & IBRD countries)European UnionFijiFinlandFragile and conflict affected situationsFranceGabonGambia, TheGeorgiaGermanyGhanaGreeceGrenadaGuatemalaGuineaGuinea-BissauGuyanaHaitiHeavily indebted poor countries (HIPC)High incomeHondurasHungaryIBRD onlyIcelandIDA & IBRD totalIDA blendIDA onlyIDA totalIndiaIndonesiaIran, Islamic Rep.IraqIrelandIsraelItalyJamaicaJapanJordanKazakhstanKenyaKiribatiKorea, Dem. People’s Rep.Korea, Rep.KuwaitKyrgyz RepublicLao PDRLate-demographic dividendLatin America & Caribbean Latin America & Caribbean (excluding high income)Latin America & the Caribbean (IDA & IBRD countries)LatviaLeast developed countries: UN classificationLebanonLesothoLiberiaLibyaLithuaniaLow & middle incomeLow incomeLower middle incomeLuxembourgMacedonia, FYRMadagascarMalawiMalaysiaMaldivesMaliMaltaMauritaniaMauritiusMexicoMicronesia, Fed. Sts.Middle East & North AfricaMiddle East & North Africa (excluding high income)Middle East & North Africa (IDA & IBRD countries)Middle incomeMoldovaMongoliaMontenegroMoroccoMozambiqueMyanmarNamibiaNepalNetherlandsNew ZealandNicaraguaNigerNigeriaNorth AmericaNorwayOECD membersOmanOther small statesPacific island small statesPakistanPanamaPapua New GuineaParaguayPeruPhilippinesPolandPortugalPost-demographic dividendPre-demographic dividendPuerto RicoQatarRomaniaRussian FederationRwandaSamoaSao Tome and PrincipeSaudi ArabiaSenegalSerbiaSierra LeoneSingaporeSlovak RepublicSloveniaSmall statesSolomon IslandsSomaliaSouth AfricaSouth AsiaSouth Asia (IDA & IBRD)South SudanSpainSri LankaSt. LuciaSt. Vincent and the GrenadinesSub-Saharan Africa Sub-Saharan Africa (excluding high income)Sub-Saharan Africa (IDA & IBRD countries)SudanSurinameSwazilandSwedenSwitzerlandSyrian Arab RepublicTajikistanTanzaniaThailandTimor-LesteTogoTongaTrinidad and TobagoTunisiaTurkeyTurkmenistanUgandaUkraineUnited Arab EmiratesUnited KingdomUnited StatesUpper middle incomeUruguayUzbekistanVanuatuVenezuela, RBVietnamWest Bank and GazaWorldYemen, Rep.ZambiaZimbabwe
línea de tiempo (timeline):
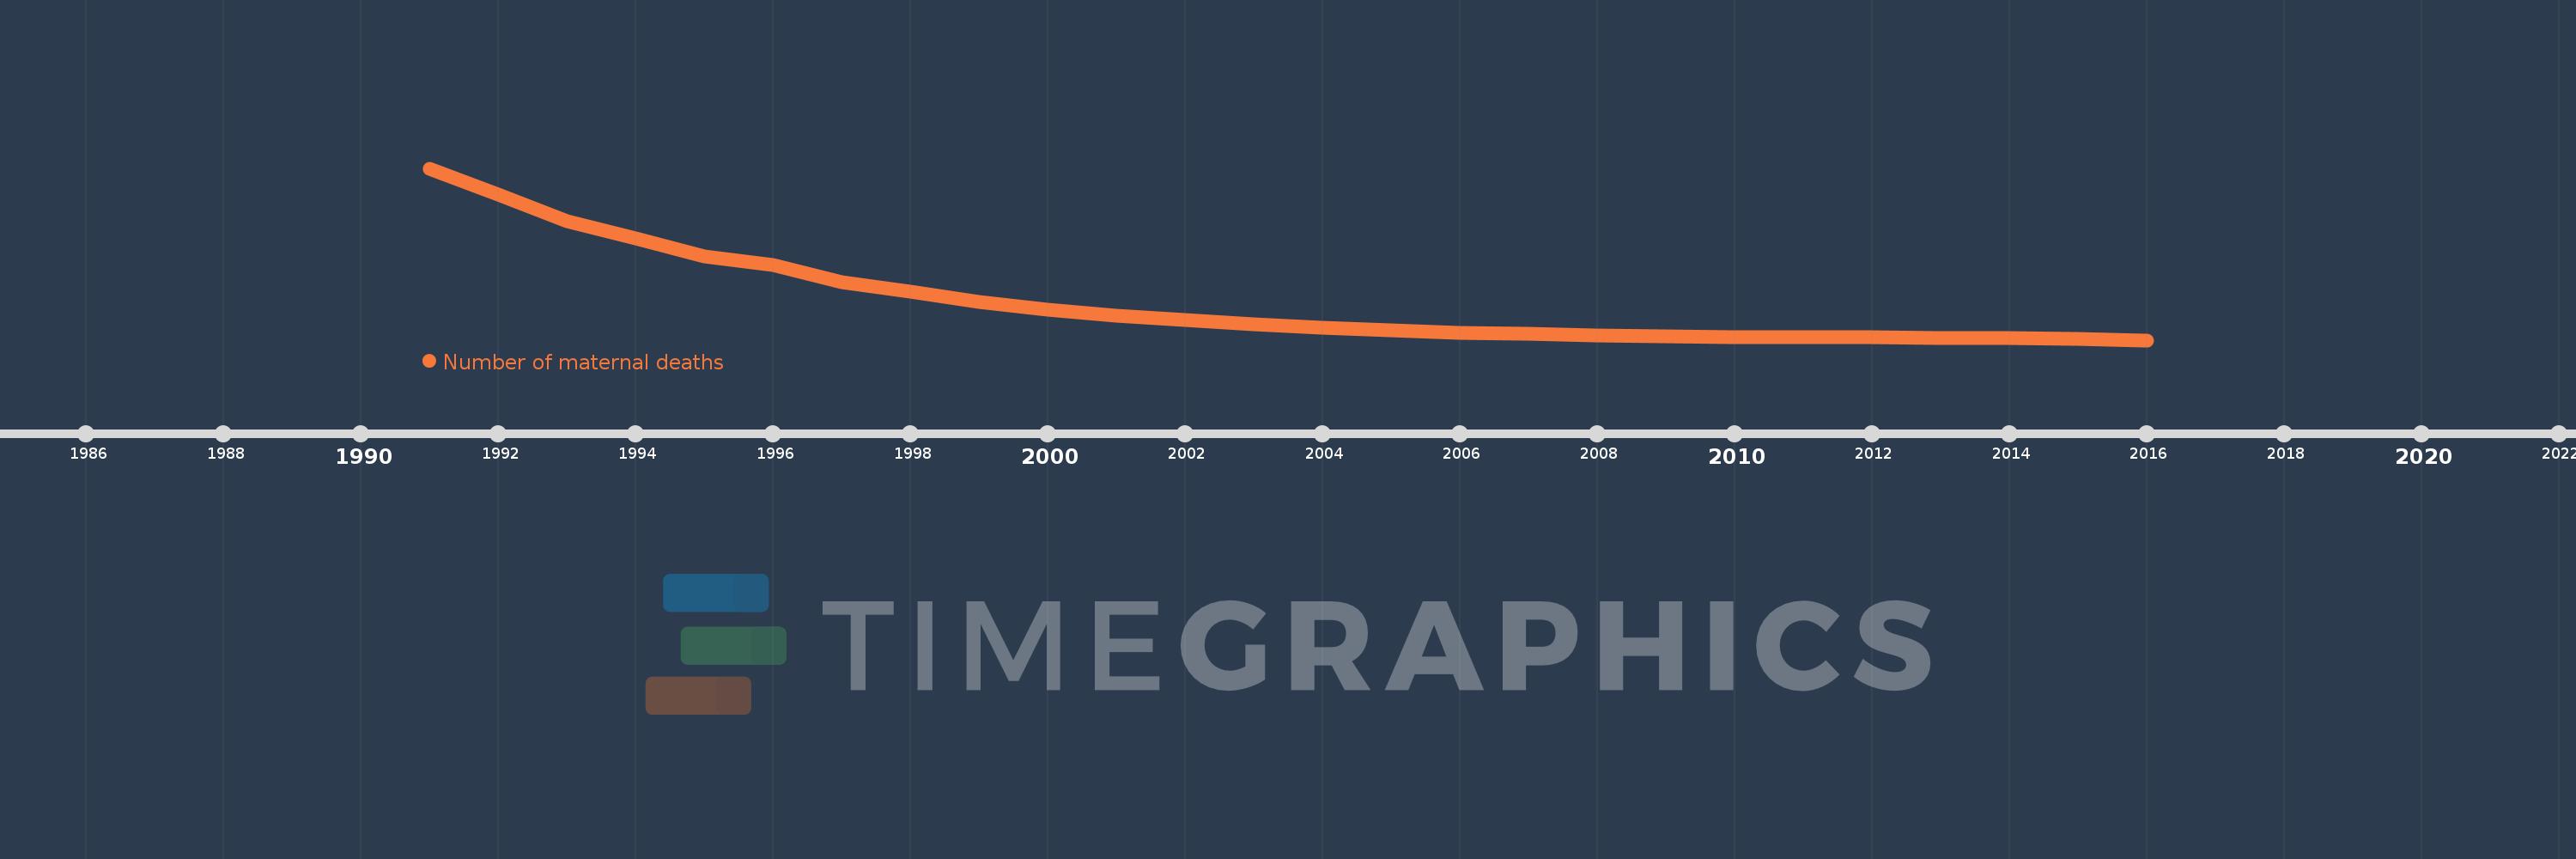
En esta escala de tiempo se presenta un gráfico de 1991 y 2016 de Iran, Islamic Rep.. Los datos de 1990 están ausentes. El número de observaciones reales por fecha: 26.
Fuente (nombre):
Indicadores del desarrollo mundial
Fuente (organización):
WHO, UNICEF, UNFPA, World Bank Group, and the United Nations Population Division. Trends in Maternal Mortality: 1990 to 2015. Geneva, World Health Organization, 2015
Categorías:
Health
Se ha actualizado:
23 abr 2017 año
Los indicadores de los cambios de valor en los últimos años
En promedio:
773.846
Mínimo:
340.0
1 ene 2016 año
Máximo:
2.3 mil
1 ene 1991 año
A la fecha de observación
Valor
Cambio absoluto
El cambio con respecto al valor anterior
1 ene 1991 año
2.3 mil
+2.3 mil
0.0%
1 ene 1992 año
2.0 mil
-300.0
-13.04%
1 ene 1993 año
1.7 mil
-300.0
-15.0%
1 ene 1994 año
1.5 mil
-200.0
-11.76%
1 ene 1995 año
1.3 mil
-200.0
-13.33%
1 ene 1996 año
1.2 mil
-100.0
-7.69%
1 ene 1997 año
1000.0
-200.0
-16.67%
1 ene 1998 año
890.0
-110.0
-11.0%
1 ene 1999 año
780.0
-110.0
-12.36%
1 ene 2000 año
690.0
-90.0
-11.54%
1 ene 2001 año
620.0
-70.0
-10.14%
1 ene 2002 año
570.0
-50.0
-8.06%
1 ene 2003 año
520.0
-50.0
-8.77%
1 ene 2004 año
480.0
-40.0
-7.69%
1 ene 2005 año
450.0
-30.0
-6.25%
1 ene 2006 año
420.0
-30.0
-6.67%
1 ene 2007 año
410.0
-10.0
-2.38%
1 ene 2008 año
390.0
-20.0
-4.88%
1 ene 2009 año
380.0
-10.0
-2.56%
1 ene 2010 año
370.0
-10.0
-2.63%
1 ene 2011 año
370.0
0.0
0.0%
1 ene 2012 año
370.0
0.0
0.0%
1 ene 2013 año
360.0
-10.0
-2.7%
1 ene 2014 año
360.0
0.0
0.0%
1 ene 2015 año
350.0
-10.0
-2.78%
1 ene 2016 año
340.0
-10.0
-2.86%
Ranking de los países por los datos estadísticos actuales

Comentarios:

Enviar
PremiumAbout & FeedbackAcuerdoPrivacidad
logo
© 2022 Selected Technologies LLC – Morgan Hill, California