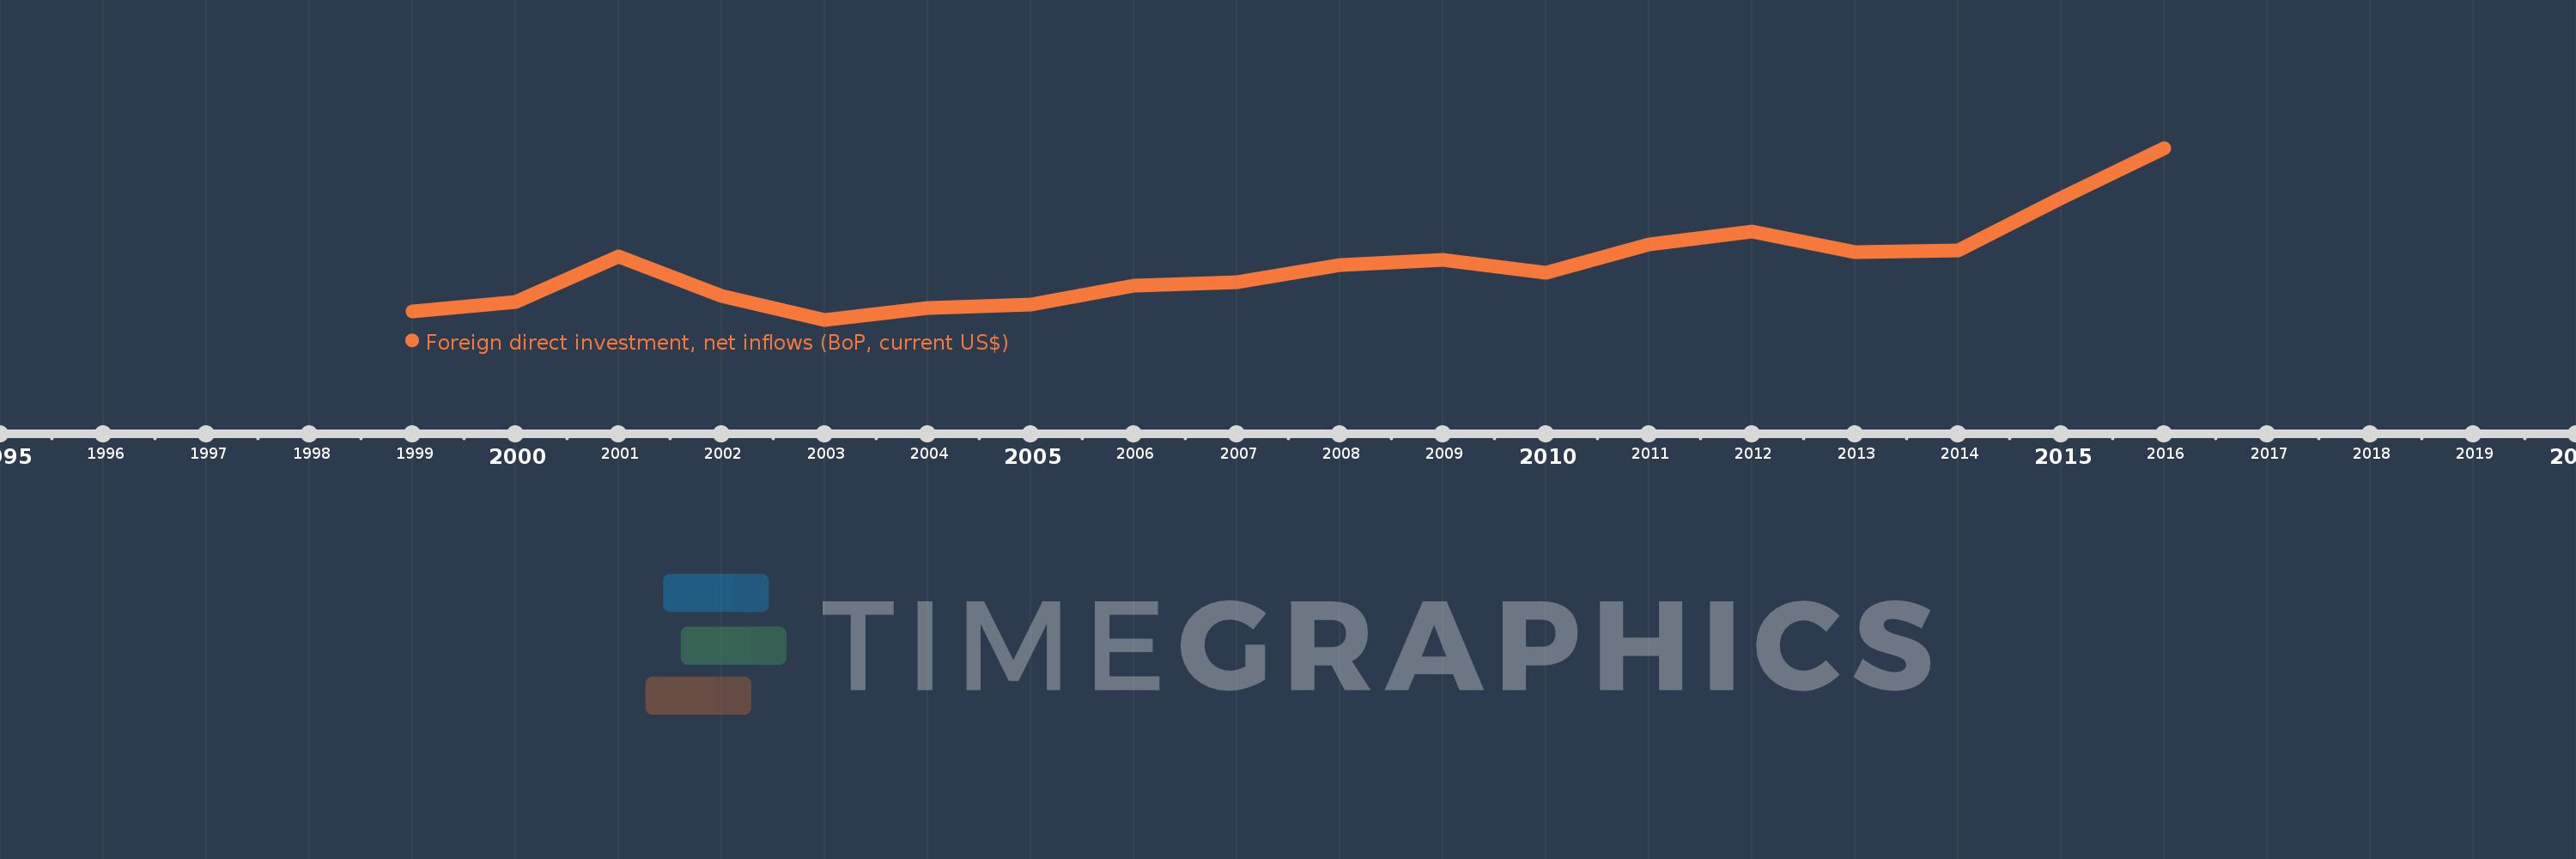
En esta escala de tiempo se presenta un gráfico de 1999 y 2016 de Hong Kong SAR, China. Los datos de 1998 están ausentes. El número de observaciones reales por fecha: 18.
Fuente (nombre):
Indicadores del desarrollo mundial
Fuente (organización):
International Monetary Fund, Balance of Payments database, supplemented by data from the United Nations Conference on Trade and Development and official national sources.
Categorías:
Economy & Growth, Financial Sector, External Debt
Se ha actualizado:
23 abr 2017 año
Los indicadores de los cambios de valor en los últimos años
En promedio:
61.068 bn
Mínimo:
6.748 bn
1 ene 2003 año
Máximo:
180.844 bn
1 ene 2016 año
A la fecha de observación
Valor
Cambio absoluto
El cambio con respecto al valor anterior
1 ene 1999 año
14.765 bn
+14.765 bn
0.0%
1 ene 2000 año
24.578 bn
+9.813 bn
66.46%
1 ene 2001 año
70.496 bn
+45.918 bn
186.83%
1 ene 2002 año
31.292 bn
-39.204 bn
-55.61%
1 ene 2003 año
6.748 bn
-24.544 bn
-78.44%
1 ene 2004 año
18.567 bn
+11.82 bn
175.16%
1 ene 2005 año
22.194 bn
+3.627 bn
19.53%
1 ene 2006 año
40.963 bn
+18.769 bn
84.57%
1 ene 2007 año
44.902 bn
+3.939 bn
9.62%
1 ene 2008 año
62.121 bn
+17.219 bn
38.35%
1 ene 2009 año
67.035 bn
+4.914 bn
7.91%
1 ene 2010 año
54.276 bn
-12.759 bn
-19.03%
1 ene 2011 año
82.709 bn
+28.433 bn
52.39%
1 ene 2012 año
96.135 bn
+13.426 bn
16.23%
1 ene 2013 año
74.887 bn
-21.248 bn
-22.1%
1 ene 2014 año
76.857 bn
+1.97 bn
2.63%
1 ene 2015 año
129.847 bn
+52.99 bn
68.95%
1 ene 2016 año
180.844 bn
+50.997 bn
39.27%
Ranking de los países por los datos estadísticos actuales