33
/es/
AIzaSyAYiBZKx7MnpbEhh9jyipgxe19OcubqV5w
August 1, 2025
149252
Haiti
HTI
true
2
1
Imports of goods and services (current LCU)
2016,2015,2014,2013,2012,2011,2010,2009,2008,2007,2006,2005,2004,2003,2002,2001,2000,1999,1998,1997,1996,1995,1994,1993,1992
Download
Estadísticas Globales de la Biblioteca →Haiti →

Imports of goods and services (current LCU)

Estas estadísticas en otros países:

AfghanistanAlbaniaAlgeriaAngolaAntigua and BarbudaArgentinaArmeniaArubaAustraliaAustriaAzerbaijanBahamas, TheBahrainBangladeshBarbadosBelarusBelgiumBelizeBeninBermudaBhutanBoliviaBosnia and HerzegovinaBotswanaBrazilBrunei DarussalamBulgariaBurkina FasoBurundiCabo VerdeCambodiaCameroonCanadaCentral African RepublicChadChileChinaColombiaComorosCongo, Dem. Rep.Congo, Rep.Costa RicaCote d'IvoireCroatiaCubaCyprusCzech RepublicDenmarkDjiboutiDominicaDominican RepublicEcuadorEgypt, Arab Rep.El SalvadorEquatorial GuineaEritreaEstoniaEthiopiaFaroe IslandsFijiFinlandFranceFrench PolynesiaGabonGambia, TheGeorgiaGermanyGhanaGreeceGrenadaGuatemalaGuineaGuinea-BissauGuyanaHaitiHondurasHong Kong SAR, ChinaHungaryIcelandIndiaIndonesiaIran, Islamic Rep.IraqIrelandIsraelItalyJamaicaJapanJordanKazakhstanKenyaKiribatiKorea, Rep.KosovoKuwaitKyrgyz RepublicLao PDRLatviaLebanonLesothoLiberiaLibyaLithuaniaLuxembourgMacao SAR, ChinaMacedonia, FYRMadagascarMalawiMalaysiaMaldivesMaliMaltaMauritaniaMauritiusMexicoMicronesia, Fed. Sts.MoldovaMongoliaMontenegroMoroccoMozambiqueMyanmarNamibiaNepalNetherlandsNew CaledoniaNew ZealandNicaraguaNigerNigeriaNorwayOmanPakistanPalauPanamaPapua New GuineaParaguayPeruPhilippinesPolandPortugalPuerto RicoQatarRomaniaRussian FederationRwandaSamoaSaudi ArabiaSenegalSerbiaSeychellesSierra LeoneSingaporeSlovak RepublicSloveniaSolomon IslandsSomaliaSouth AfricaSouth SudanSpainSri LankaSt. Kitts and NevisSt. LuciaSt. Vincent and the GrenadinesSudanSurinameSwazilandSwedenSwitzerlandSyrian Arab RepublicTajikistanTanzaniaThailandTimor-LesteTogoTongaTrinidad and TobagoTunisiaTurkeyTurkmenistanUgandaUkraineUnited Arab EmiratesUnited KingdomUnited StatesUruguayUzbekistanVanuatuVenezuela, RBVietnamWest Bank and GazaYemen, Rep.ZambiaZimbabwe

línea de tiempo (timeline):

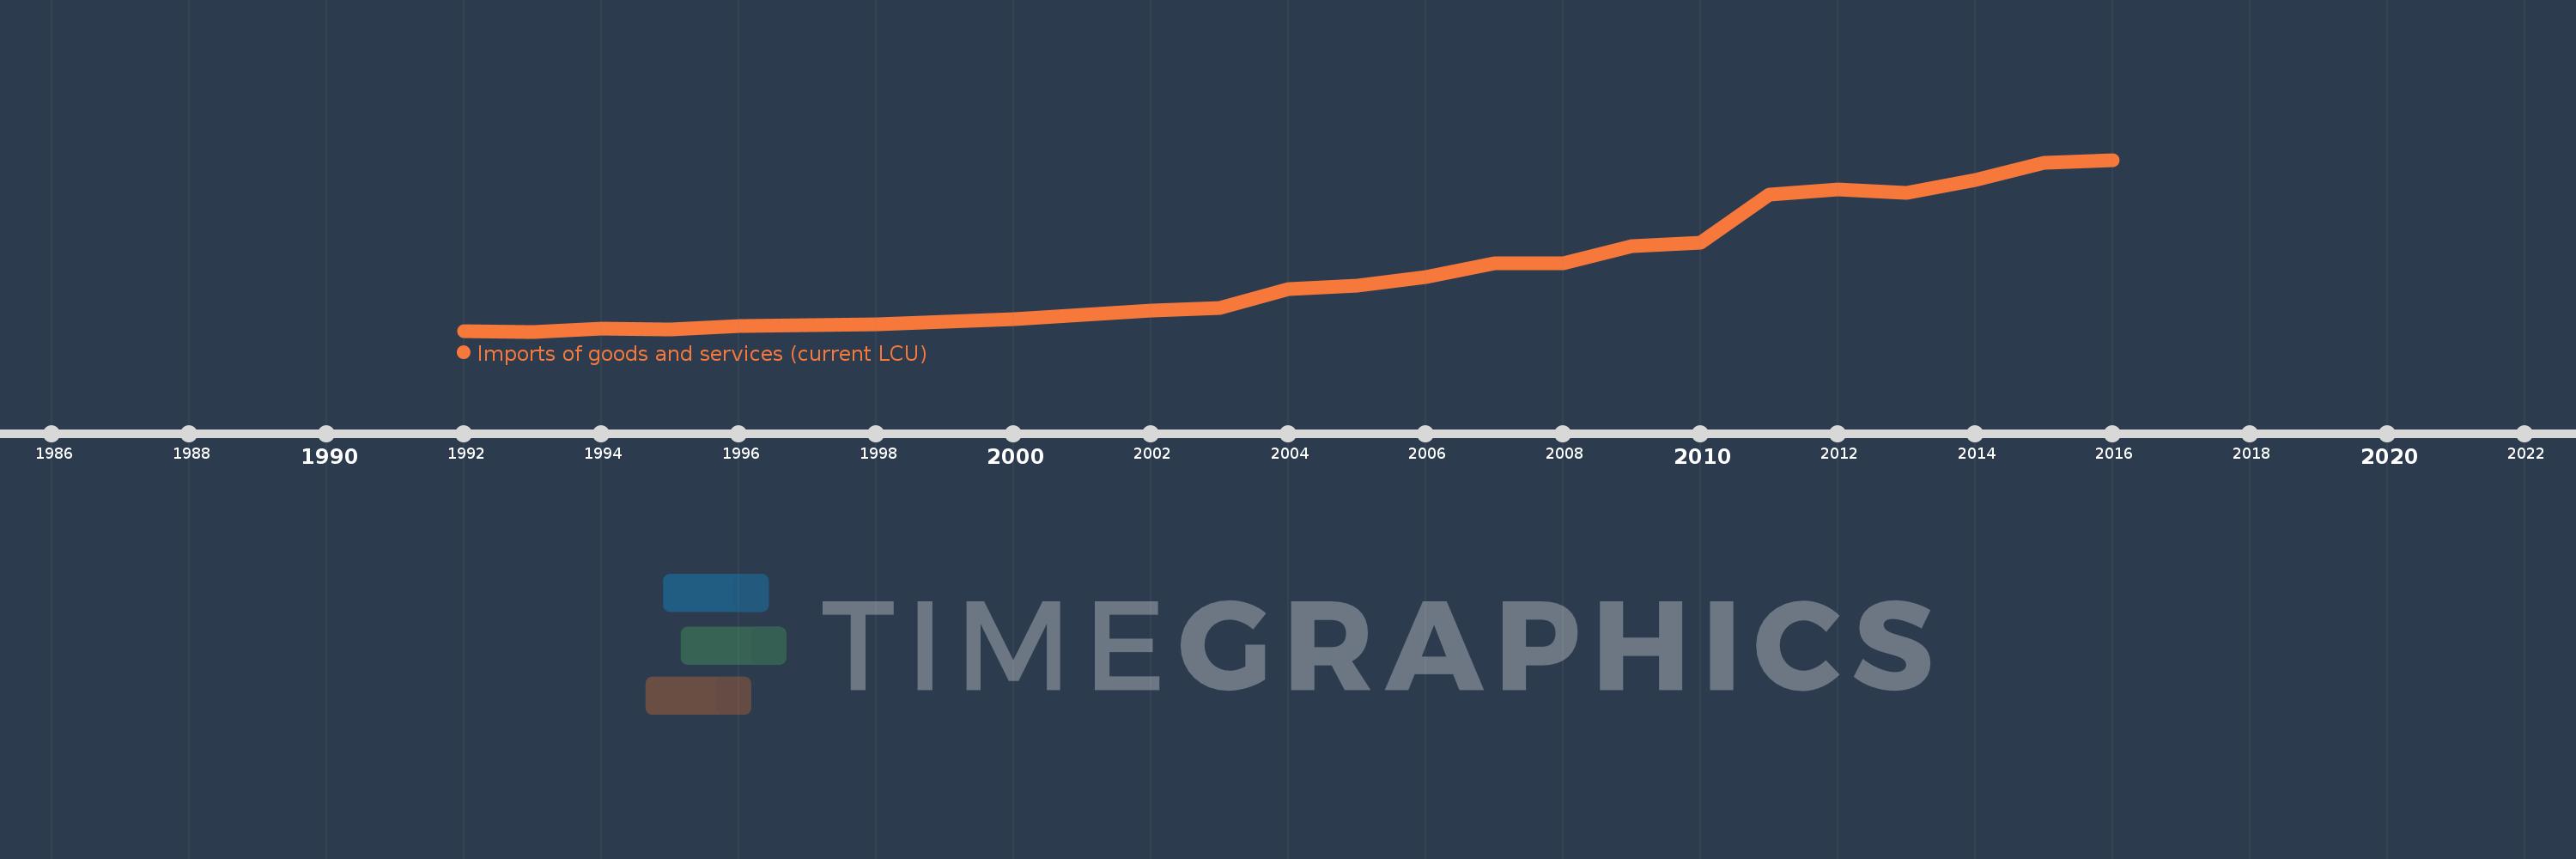
En esta escala de tiempo se presenta un gráfico de 1992 y 2016 de Haiti. Los datos de 1991 están ausentes. El número de observaciones reales por fecha: 25.

Fuente (nombre):

Indicadores del desarrollo mundial

Fuente (organización):

World Bank national accounts data, and OECD National Accounts data files.

Categorías:

Economy & Growth

Se ha actualizado:

23 abr 2017 año

Los indicadores de los cambios de valor en los últimos años

En promedio:
77.216 bn
Mínimo:
5.167 bn
1 ene 1993 año
Máximo:
215.31 bn
1 ene 2016 año
A la fecha de observación
Valor
Cambio absoluto
El cambio con respecto al valor anterior
1 ene 1992 año
5.332 bn
+5.332 bn
0.0%
1 ene 1993 año
5.167 bn
-165.0 millones
-3.09%
1 ene 1994 año
8.78 bn
+3.613 bn
69.92%
1 ene 1995 año
7.898 bn
-882.0 millones
-10.05%
1 ene 1996 año
11.695 bn
+3.797 bn
48.08%
1 ene 1997 año
13.479 bn
+1.784 bn
15.25%
1 ene 1998 año
14.28 bn
+801.0 millones
5.94%
1 ene 1999 año
16.77 bn
+2.49 bn
17.44%
1 ene 2000 año
20.568 bn
+3.798 bn
22.65%
1 ene 2001 año
25.923 bn
+5.355 bn
26.04%
1 ene 2002 año
30.973 bn
+5.05 bn
19.48%
1 ene 2003 año
33.851 bn
+2.878 bn
9.29%
1 ene 2004 año
57.317 bn
+23.466 bn
69.32%
1 ene 2005 año
61.365 bn
+4.048 bn
7.06%
1 ene 2006 año
72.154 bn
+10.789 bn
17.58%
1 ene 2007 año
88.769 bn
+16.615 bn
23.03%
1 ene 2008 año
89.179 bn
+410.0 millones
0.46%
1 ene 2009 año
109.215 bn
+20.036 bn
22.47%
1 ene 2010 año
114.048 bn
+4.833 bn
4.43%
1 ene 2011 año
172.849 bn
+58.801 bn
51.56%
1 ene 2012 año
178.605 bn
+5.756 bn
3.33%
1 ene 2013 año
174.4 bn
-4.205 bn
-2.35%
1 ene 2014 año
190.609 bn
+16.209 bn
9.29%
1 ene 2015 año
211.858 bn
+21.249 bn
11.15%
1 ene 2016 año
215.31 bn
+3.452 bn
1.63%

Ranking de los países por los datos estadísticos actuales