29
/es/
es
AIzaSyAYiBZKx7MnpbEhh9jyipgxe19OcubqV5w
April 1, 2024
149200
Haiti
HTI
true
2
1
Gross national expenditure (current LCU)
2016,2015,2014,2013,2012,2011,2010,2009,2008,2007,2006,2005,2004,2003,2002,2001,2000,1999,1998,1997,1996,1995,1994,1993,1992
Download
Estadísticas Globales de la Biblioteca →Haiti →

Gross national expenditure (current LCU)

Estas estadísticas en otros países:
AfghanistanAlbaniaAlgeriaAngolaAntigua and BarbudaArgentinaArmeniaArubaAustraliaAustriaAzerbaijanBahamas, TheBahrainBangladeshBarbadosBelarusBelgiumBelizeBeninBermudaBhutanBoliviaBosnia and HerzegovinaBotswanaBrazilBrunei DarussalamBulgariaBurkina FasoBurundiCabo VerdeCambodiaCameroonCanadaCentral African RepublicChadChileChinaColombiaComorosCongo, Dem. Rep.Congo, Rep.Costa RicaCote d'IvoireCroatiaCubaCyprusCzech RepublicDenmarkDjiboutiDominicaDominican RepublicEcuadorEgypt, Arab Rep.El SalvadorEquatorial GuineaEritreaEstoniaEthiopiaFaroe IslandsFijiFinlandFranceFrench PolynesiaGabonGambia, TheGeorgiaGermanyGhanaGreeceGrenadaGuatemalaGuineaGuinea-BissauGuyanaHaitiHondurasHong Kong SAR, ChinaHungaryIcelandIndiaIndonesiaIran, Islamic Rep.IraqIrelandIsraelItalyJamaicaJapanJordanKazakhstanKenyaKiribatiKorea, Rep.KosovoKuwaitKyrgyz RepublicLao PDRLatviaLebanonLesothoLiberiaLibyaLithuaniaLuxembourgMacao SAR, ChinaMacedonia, FYRMadagascarMalawiMalaysiaMaldivesMaliMaltaMauritaniaMauritiusMexicoMicronesia, Fed. Sts.MoldovaMongoliaMontenegroMoroccoMozambiqueMyanmarNamibiaNepalNetherlandsNew CaledoniaNew ZealandNicaraguaNigerNigeriaNorwayOmanPakistanPalauPanamaPapua New GuineaParaguayPeruPhilippinesPolandPortugalPuerto RicoQatarRomaniaRussian FederationRwandaSamoaSaudi ArabiaSenegalSerbiaSeychellesSierra LeoneSingaporeSlovak RepublicSloveniaSolomon IslandsSomaliaSouth AfricaSouth SudanSpainSri LankaSt. Kitts and NevisSt. LuciaSt. Vincent and the GrenadinesSudanSurinameSwazilandSwedenSwitzerlandSyrian Arab RepublicTajikistanTanzaniaThailandTimor-LesteTogoTongaTrinidad and TobagoTunisiaTurkeyTurkmenistanUgandaUkraineUnited Arab EmiratesUnited KingdomUnited StatesUruguayUzbekistanVanuatuVenezuela, RBVietnamWest Bank and GazaYemen, Rep.ZambiaZimbabwe
línea de tiempo (timeline):
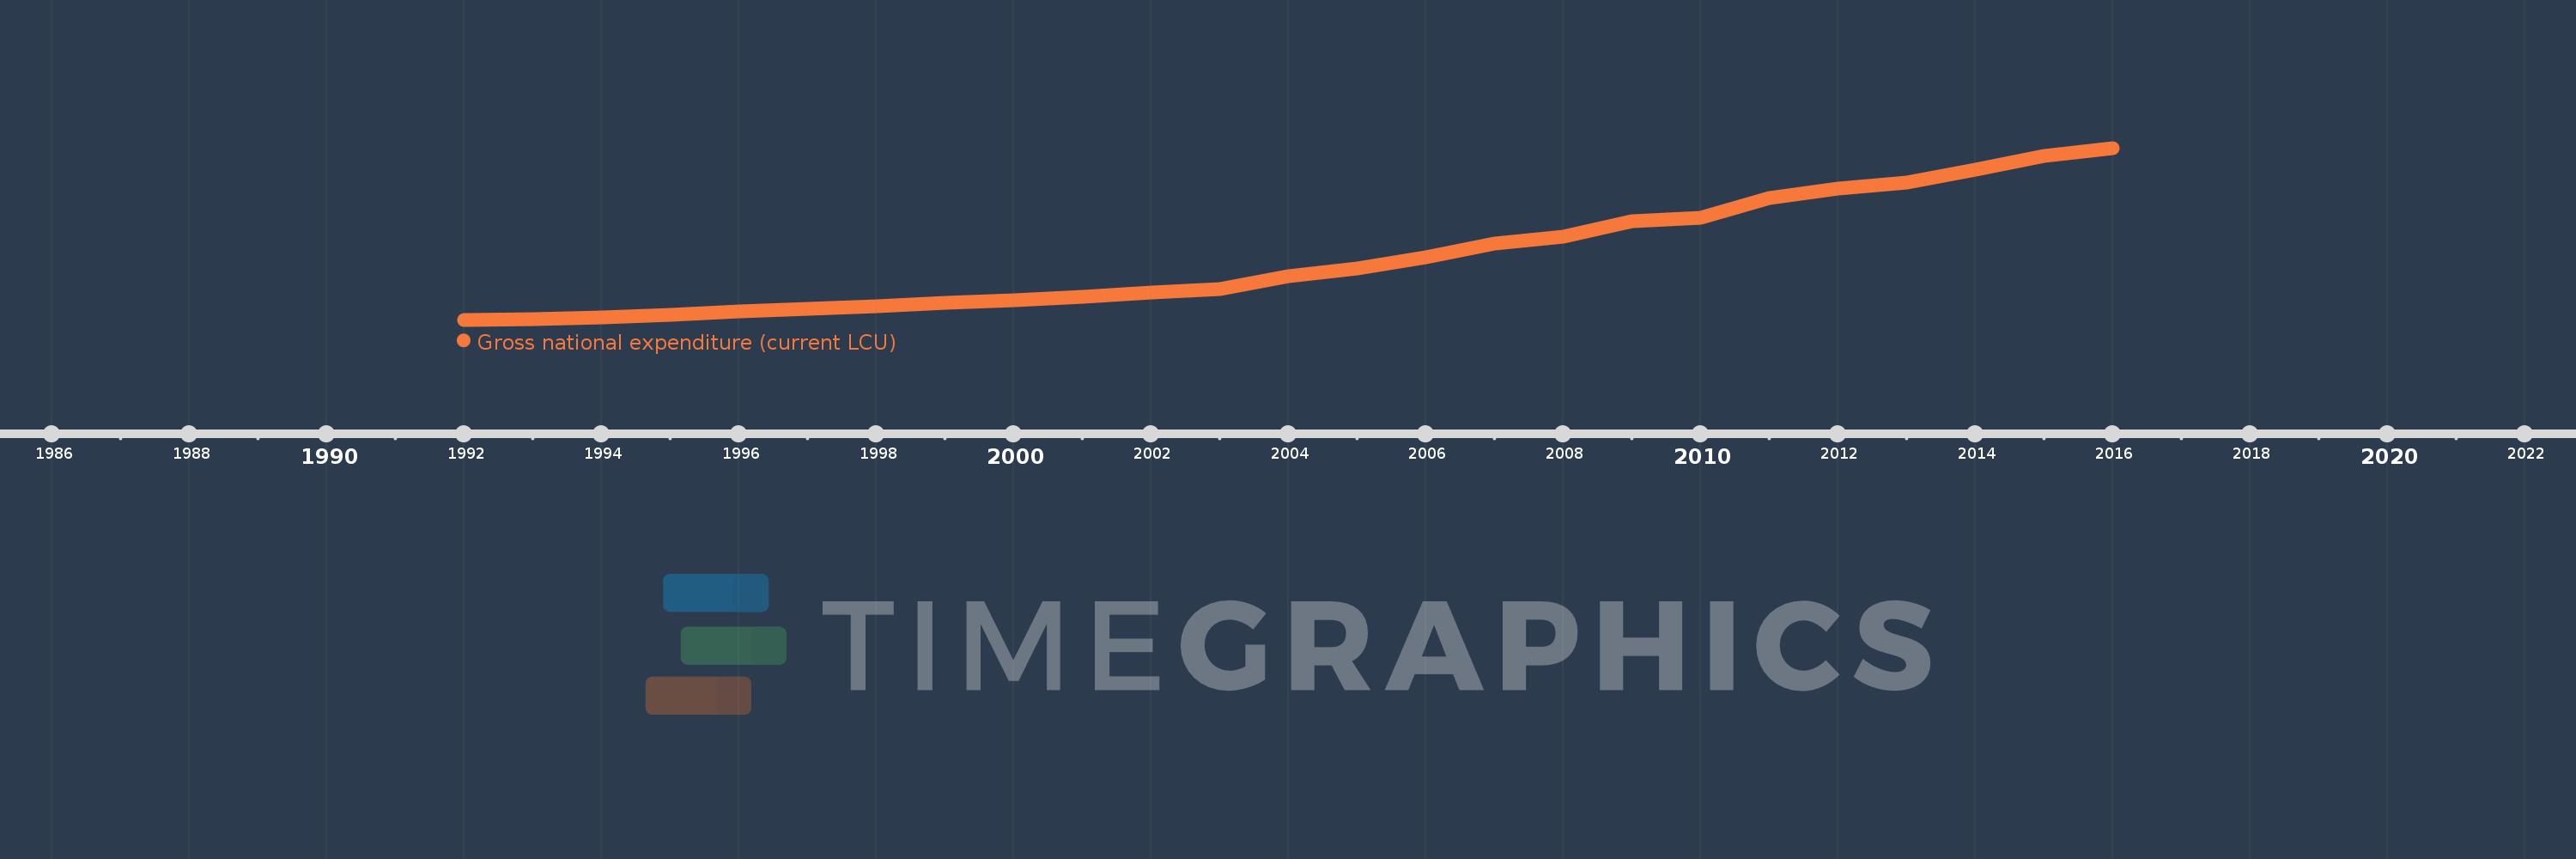
En esta escala de tiempo se presenta un gráfico de 1992 y 2016 de Haiti. Los datos de 1991 están ausentes. El número de observaciones reales por fecha: 25.
Fuente (nombre):
Indicadores del desarrollo mundial
Fuente (organización):
World Bank national accounts data, and OECD National Accounts data files.
Categorías:
Economy & Growth
Se ha actualizado:
23 abr 2017 año
Los indicadores de los cambios de valor en los últimos años
En promedio:
214.405 bn
Mínimo:
21.545 bn
1 ene 1992 año
Máximo:
555.829 bn
1 ene 2016 año
A la fecha de observación
Valor
Cambio absoluto
El cambio con respecto al valor anterior
1 ene 1992 año
21.545 bn
+21.545 bn
0.0%
1 ene 1993 año
24.296 bn
+2.751 bn
12.77%
1 ene 1994 año
29.43 bn
+5.134 bn
21.13%
1 ene 1995 año
37.805 bn
+8.375 bn
28.46%
1 ene 1996 año
48.704 bn
+10.899 bn
28.83%
1 ene 1997 año
54.842 bn
+6.138 bn
12.6%
1 ene 1998 año
62.64 bn
+7.798 bn
14.22%
1 ene 1999 año
73.53 bn
+10.89 bn
17.39%
1 ene 2000 año
81.339 bn
+7.809 bn
10.62%
1 ene 2001 año
93.654 bn
+12.315 bn
15.14%
1 ene 2002 año
106.079 bn
+12.425 bn
13.27%
1 ene 2003 año
116.476 bn
+10.397 bn
9.8%
1 ene 2004 año
158.043 bn
+41.567 bn
35.69%
1 ene 2005 año
181.524 bn
+23.481 bn
14.86%
1 ene 2006 año
216.597 bn
+35.073 bn
19.32%
1 ene 2007 año
257.344 bn
+40.747 bn
18.81%
1 ene 2008 año
279.746 bn
+22.402 bn
8.71%
1 ene 2009 año
327.927 bn
+48.181 bn
17.22%
1 ene 2010 año
339.844 bn
+11.917 bn
3.63%
1 ene 2011 año
398.845 bn
+59.001 bn
17.36%
1 ene 2012 año
428.611 bn
+29.766 bn
7.46%
1 ene 2013 año
446.995 bn
+18.384 bn
4.29%
1 ene 2014 año
488.582 bn
+41.587 bn
9.3%
1 ene 2015 año
529.909 bn
+41.327 bn
8.46%
1 ene 2016 año
555.829 bn
+25.92 bn
4.89%
Ranking de los países por los datos estadísticos actuales

Comentarios:

Enviar
PremiumAbout & FeedbackAcuerdoPrivacidad
logo
© 2022 Selected Technologies LLC – Morgan Hill, California