33
/es/
AIzaSyAYiBZKx7MnpbEhh9jyipgxe19OcubqV5w
August 1, 2025
139506
Germany
DEU
true
2
1
Manufacturing, value added (current LCU)
2016,2015,2014,2013,2012,2011,2010,2009,2008,2007,2006,2005,2004,2003,2002,2001,2000,1999,1998,1997,1996,1995,1994,1993,1992
Download
Estadísticas Globales de la Biblioteca →Germany →

Manufacturing, value added (current LCU)

Estas estadísticas en otros países:

AfghanistanAlbaniaAlgeriaAndorraAngolaAntigua and BarbudaArgentinaArmeniaArubaAustraliaAustriaAzerbaijanBahamas, TheBahrainBangladeshBarbadosBelarusBelgiumBelizeBeninBermudaBhutanBoliviaBosnia and HerzegovinaBotswanaBrazilBrunei DarussalamBurkina FasoBurundiCabo VerdeCambodiaCameroonCanadaCayman IslandsCentral African RepublicChadChileChinaColombiaComorosCongo, Dem. Rep.Congo, Rep.Costa RicaCote d'IvoireCroatiaCubaCyprusCzech RepublicDenmarkDjiboutiDominicaDominican RepublicEcuadorEgypt, Arab Rep.El SalvadorEquatorial GuineaEritreaEstoniaEthiopiaFaroe IslandsFijiFinlandFranceGabonGambia, TheGeorgiaGermanyGhanaGreeceGrenadaGuatemalaGuineaGuinea-BissauGuyanaHondurasHong Kong SAR, ChinaHungaryIcelandIndiaIndonesiaIran, Islamic Rep.IraqIrelandItalyJamaicaJapanJordanKazakhstanKenyaKiribatiKorea, Rep.KosovoKuwaitKyrgyz RepublicLao PDRLatviaLebanonLesothoLiberiaLibyaLithuaniaLuxembourgMacao SAR, ChinaMacedonia, FYRMadagascarMalawiMalaysiaMaldivesMaliMaltaMarshall IslandsMauritaniaMauritiusMexicoMicronesia, Fed. Sts.MoldovaMongoliaMontenegroMoroccoMozambiqueMyanmarNamibiaNepalNetherlandsNew CaledoniaNew ZealandNicaraguaNigerNigeriaNorwayOmanPakistanPalauPanamaPapua New GuineaParaguayPeruPhilippinesPolandPortugalPuerto RicoQatarRomaniaRussian FederationRwandaSamoaSao Tome and PrincipeSaudi ArabiaSenegalSerbiaSeychellesSierra LeoneSingaporeSlovak RepublicSloveniaSolomon IslandsSomaliaSouth AfricaSpainSri LankaSt. Kitts and NevisSt. LuciaSt. Vincent and the GrenadinesSudanSurinameSwazilandSwedenSwitzerlandSyrian Arab RepublicTajikistanTanzaniaThailandTimor-LesteTogoTongaTrinidad and TobagoTunisiaTurkeyTurkmenistanTuvaluUgandaUkraineUnited Arab EmiratesUnited KingdomUnited StatesUruguayUzbekistanVanuatuVenezuela, RBVietnamWest Bank and GazaYemen, Rep.ZambiaZimbabwe

línea de tiempo (timeline):

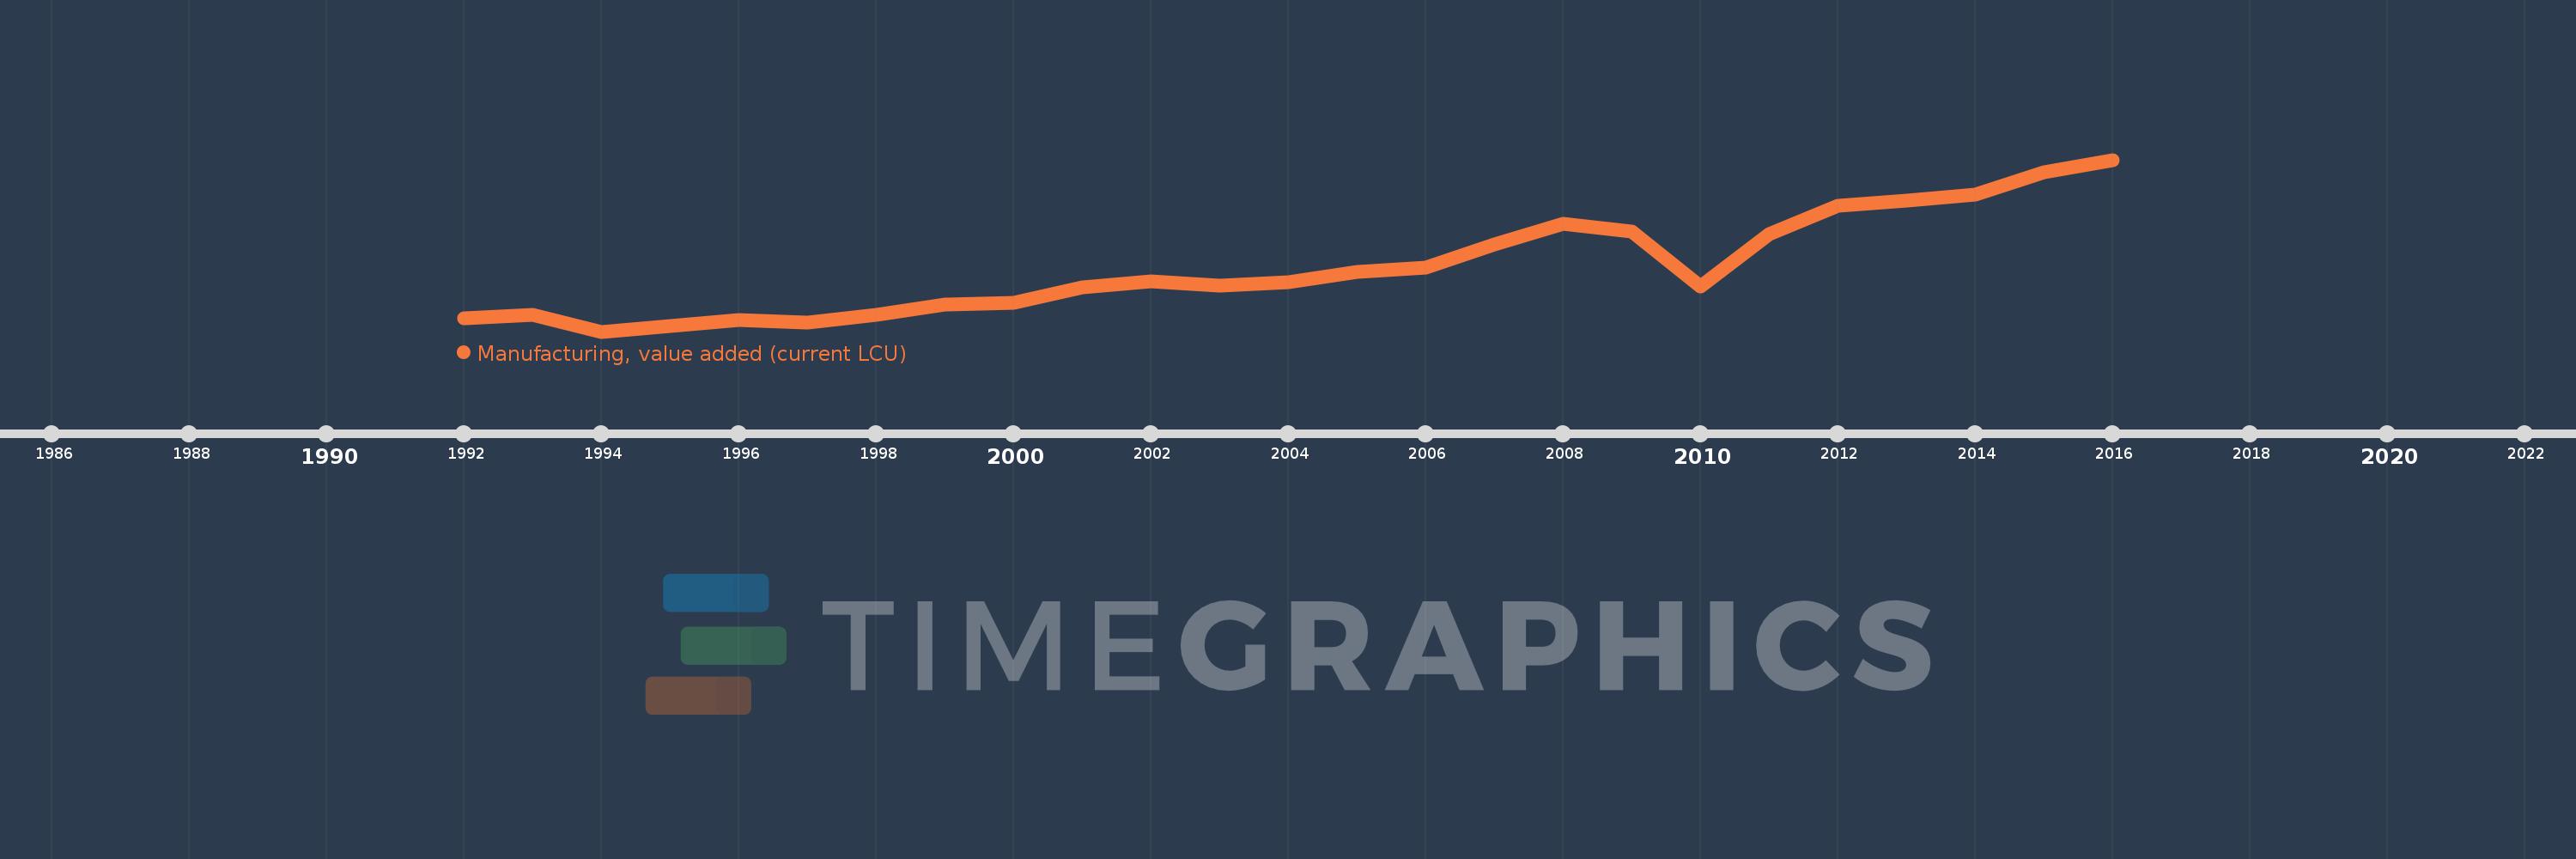
En esta escala de tiempo se presenta un gráfico de 1992 y 2016 de Germany. Los datos de 1991 están ausentes. El número de observaciones reales por fecha: 25.

Fuente (nombre):

Indicadores del desarrollo mundial

Fuente (organización):

World Bank national accounts data, and OECD National Accounts data files.

Categorías:

Economy & Growth

Se ha actualizado:

23 abr 2017 año

Los indicadores de los cambios de valor en los últimos años

En promedio:
467.308 bn
Mínimo:
374.721 bn
1 ene 1994 año
Máximo:
622.608 bn
1 ene 2016 año
A la fecha de observación
Valor
Cambio absoluto
El cambio con respecto al valor anterior
1 ene 1992 año
393.997 bn
+393.997 bn
0.0%
1 ene 1993 año
398.93 bn
+4.933 bn
1.25%
1 ene 1994 año
374.721 bn
-24.209 bn
-6.07%
1 ene 1995 año
382.916 bn
+8.195 bn
2.19%
1 ene 1996 año
391.746 bn
+8.83 bn
2.31%
1 ene 1997 año
387.844 bn
-3.902 bn
-1.0%
1 ene 1998 año
399.273 bn
+11.429 bn
2.95%
1 ene 1999 año
413.706 bn
+14.433 bn
3.61%
1 ene 2000 año
415.94 bn
+2.234 bn
0.54%
1 ene 2001 año
438.718 bn
+22.778 bn
5.48%
1 ene 2002 año
446.992 bn
+8.274 bn
1.89%
1 ene 2003 año
441.359 bn
-5.633 bn
-1.26%
1 ene 2004 año
445.384 bn
+4.025 bn
0.91%
1 ene 2005 año
460.474 bn
+15.09 bn
3.39%
1 ene 2006 año
467.4 bn
+6.926 bn
1.5%
1 ene 2007 año
500.866 bn
+33.466 bn
7.16%
1 ene 2008 año
530.125 bn
+29.259 bn
5.84%
1 ene 2009 año
518.726 bn
-11.399 bn
-2.15%
1 ene 2010 año
439.843 bn
-78.883 bn
-15.21%
1 ene 2011 año
515.175 bn
+75.332 bn
17.13%
1 ene 2012 año
556.004 bn
+40.829 bn
7.93%
1 ene 2013 año
563.279 bn
+7.275 bn
1.31%
1 ene 2014 año
572.186 bn
+8.907 bn
1.58%
1 ene 2015 año
604.487 bn
+32.301 bn
5.65%
1 ene 2016 año
622.608 bn
+18.121 bn
3.0%

Ranking de los países por los datos estadísticos actuales