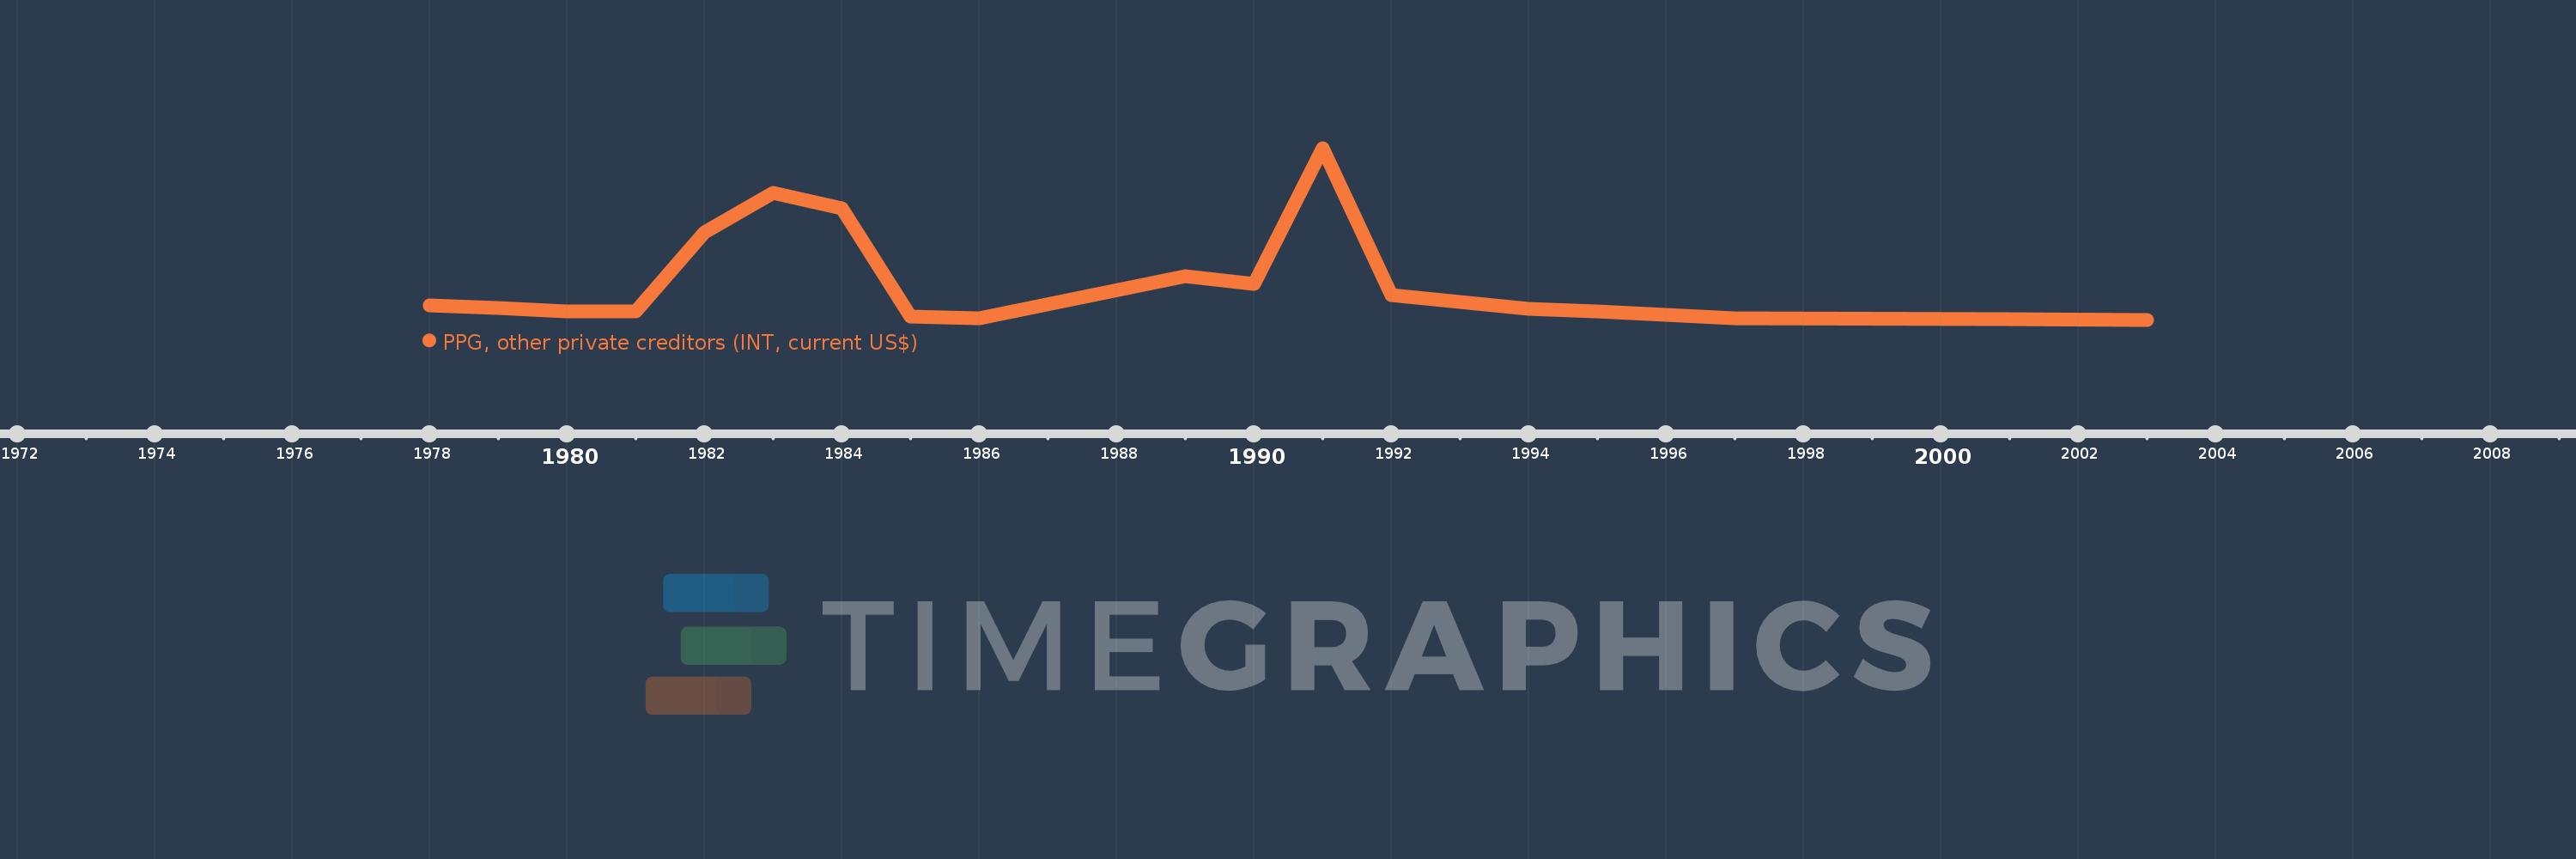
En esta escala de tiempo se presenta un gráfico de 1978 y 2003 de Gambia, The. Los datos de 1977 están ausentes. El número de observaciones reales por fecha: 20.
Fuente (nombre):
Indicadores del desarrollo mundial
Fuente (organización):
World Bank, International Debt Statistics.
Categorías:
External Debt
Se ha actualizado:
23 abr 2017 año
Los indicadores de los cambios de valor en los últimos años
En promedio:
178.45 mil
Mínimo:
2.0 mil
1 ene 2003 año
Máximo:
878.0 mil
1 ene 1991 año
A la fecha de observación
Valor
Cambio absoluto
El cambio con respecto al valor anterior
1 ene 1978 año
77.0 mil
+77.0 mil
0.0%
1 ene 1979 año
61.0 mil
-16.0 mil
-20.78%
1 ene 1980 año
44.0 mil
-17.0 mil
-27.87%
1 ene 1981 año
46.0 mil
+2.0 mil
4.55%
1 ene 1982 año
446.0 mil
+400.0 mil
869.57%
1 ene 1983 año
651.0 mil
+205.0 mil
45.96%
1 ene 1984 año
568.0 mil
-83.0 mil
-12.75%
1 ene 1985 año
17.0 mil
-551.0 mil
-97.01%
1 ene 1986 año
8.0 mil
-9.0 mil
-52.94%
1 ene 1989 año
225.0 mil
+217.0 mil
2.71 mil%
1 ene 1990 año
183.0 mil
-42.0 mil
-18.67%
1 ene 1991 año
878.0 mil
+695.0 mil
379.78%
1 ene 1992 año
128.0 mil
-750.0 mil
-85.42%
1 ene 1993 año
93.0 mil
-35.0 mil
-27.34%
1 ene 1994 año
57.0 mil
-36.0 mil
-38.71%
1 ene 1995 año
43.0 mil
-14.0 mil
-24.56%
1 ene 1996 año
27.0 mil
-16.0 mil
-37.21%
1 ene 1997 año
9.0 mil
-18.0 mil
-66.67%
1 ene 2001 año
6.0 mil
-3.0 mil
-33.33%
1 ene 2003 año
2.0 mil
-4.0 mil
-66.67%
Ranking de los países por los datos estadísticos actuales