33
/es/
AIzaSyAYiBZKx7MnpbEhh9jyipgxe19OcubqV5w
August 1, 2025
136088
Gabon
GAB
true
2
1
Primary completion rate, total (% of relevant age group)
2004,2003,1998,1997,1996,1993,1990,1989,1988,1986,1985,1984,1983,1982,1981,1980,1979,1978,1977,1976,1974,1973
Download
Estadísticas Globales de la Biblioteca →Gabon →

Primary completion rate, total (% of relevant age group)

Estas estadísticas en otros países:

AfghanistanAlbaniaAlgeriaAngolaAntigua and BarbudaArab WorldArgentinaArmeniaArubaAustriaAzerbaijanBahamas, TheBahrainBangladeshBarbadosBelarusBelgiumBelizeBeninBermudaBhutanBoliviaBosnia and HerzegovinaBotswanaBrazilBritish Virgin IslandsBrunei DarussalamBulgariaBurkina FasoBurundiCabo VerdeCambodiaCameroonCanadaCaribbean small statesCentral African RepublicCentral Europe and the BalticsChadChileChinaColombiaComorosCongo, Dem. Rep.Congo, Rep.Costa RicaCote d'IvoireCroatiaCubaCyprusCzech RepublicDenmarkDjiboutiDominicaDominican RepublicEarly-demographic dividendEast Asia & PacificEast Asia & Pacific (excluding high income)East Asia & Pacific (IDA & IBRD countries)EcuadorEgypt, Arab Rep.El SalvadorEquatorial GuineaEritreaEstoniaEthiopiaEuro areaEurope & Central AsiaEurope & Central Asia (excluding high income)Europe & Central Asia (IDA & IBRD countries)European UnionFijiFinlandFragile and conflict affected situationsFranceGabonGambia, TheGeorgiaGermanyGhanaGreeceGrenadaGuatemalaGuineaGuinea-BissauGuyanaHaitiHeavily indebted poor countries (HIPC)High incomeHondurasHong Kong SAR, ChinaHungaryIBRD onlyIcelandIDA & IBRD totalIDA blendIDA onlyIDA totalIndiaIndonesiaIran, Islamic Rep.IraqIrelandIsraelItalyJamaicaJapanJordanKazakhstanKenyaKiribatiKorea, Dem. People’s Rep.Korea, Rep.KuwaitKyrgyz RepublicLao PDRLate-demographic dividendLatin America & Caribbean Latin America & Caribbean (excluding high income)Latin America & the Caribbean (IDA & IBRD countries)LatviaLeast developed countries: UN classificationLebanonLesothoLiberiaLibyaLiechtensteinLithuaniaLow & middle incomeLow incomeLower middle incomeLuxembourgMacao SAR, ChinaMacedonia, FYRMadagascarMalawiMalaysiaMaldivesMaliMaltaMarshall IslandsMauritaniaMauritiusMexicoMiddle East & North AfricaMiddle East & North Africa (excluding high income)Middle East & North Africa (IDA & IBRD countries)Middle incomeMoldovaMongoliaMontenegroMoroccoMozambiqueMyanmarNamibiaNauruNepalNetherlandsNew ZealandNicaraguaNigerNigeriaNorwayOECD membersOmanOther small statesPacific island small statesPakistanPalauPanamaPapua New GuineaParaguayPeruPhilippinesPolandPortugalPost-demographic dividendPre-demographic dividendQatarRomaniaRussian FederationRwandaSamoaSan MarinoSao Tome and PrincipeSaudi ArabiaSenegalSerbiaSeychellesSierra LeoneSlovak RepublicSloveniaSmall statesSolomon IslandsSouth AfricaSouth AsiaSouth Asia (IDA & IBRD)South SudanSpainSri LankaSt. Kitts and NevisSt. LuciaSt. Vincent and the GrenadinesSub-Saharan Africa Sub-Saharan Africa (excluding high income)Sub-Saharan Africa (IDA & IBRD countries)SudanSurinameSwazilandSwedenSwitzerlandSyrian Arab RepublicTajikistanTanzaniaThailandTimor-LesteTogoTongaTrinidad and TobagoTunisiaTurkeyTuvaluUgandaUkraineUnited Arab EmiratesUpper middle incomeUruguayUzbekistanVanuatuVenezuela, RBVietnamWest Bank and GazaWorldYemen, Rep.ZambiaZimbabwe

línea de tiempo (timeline):

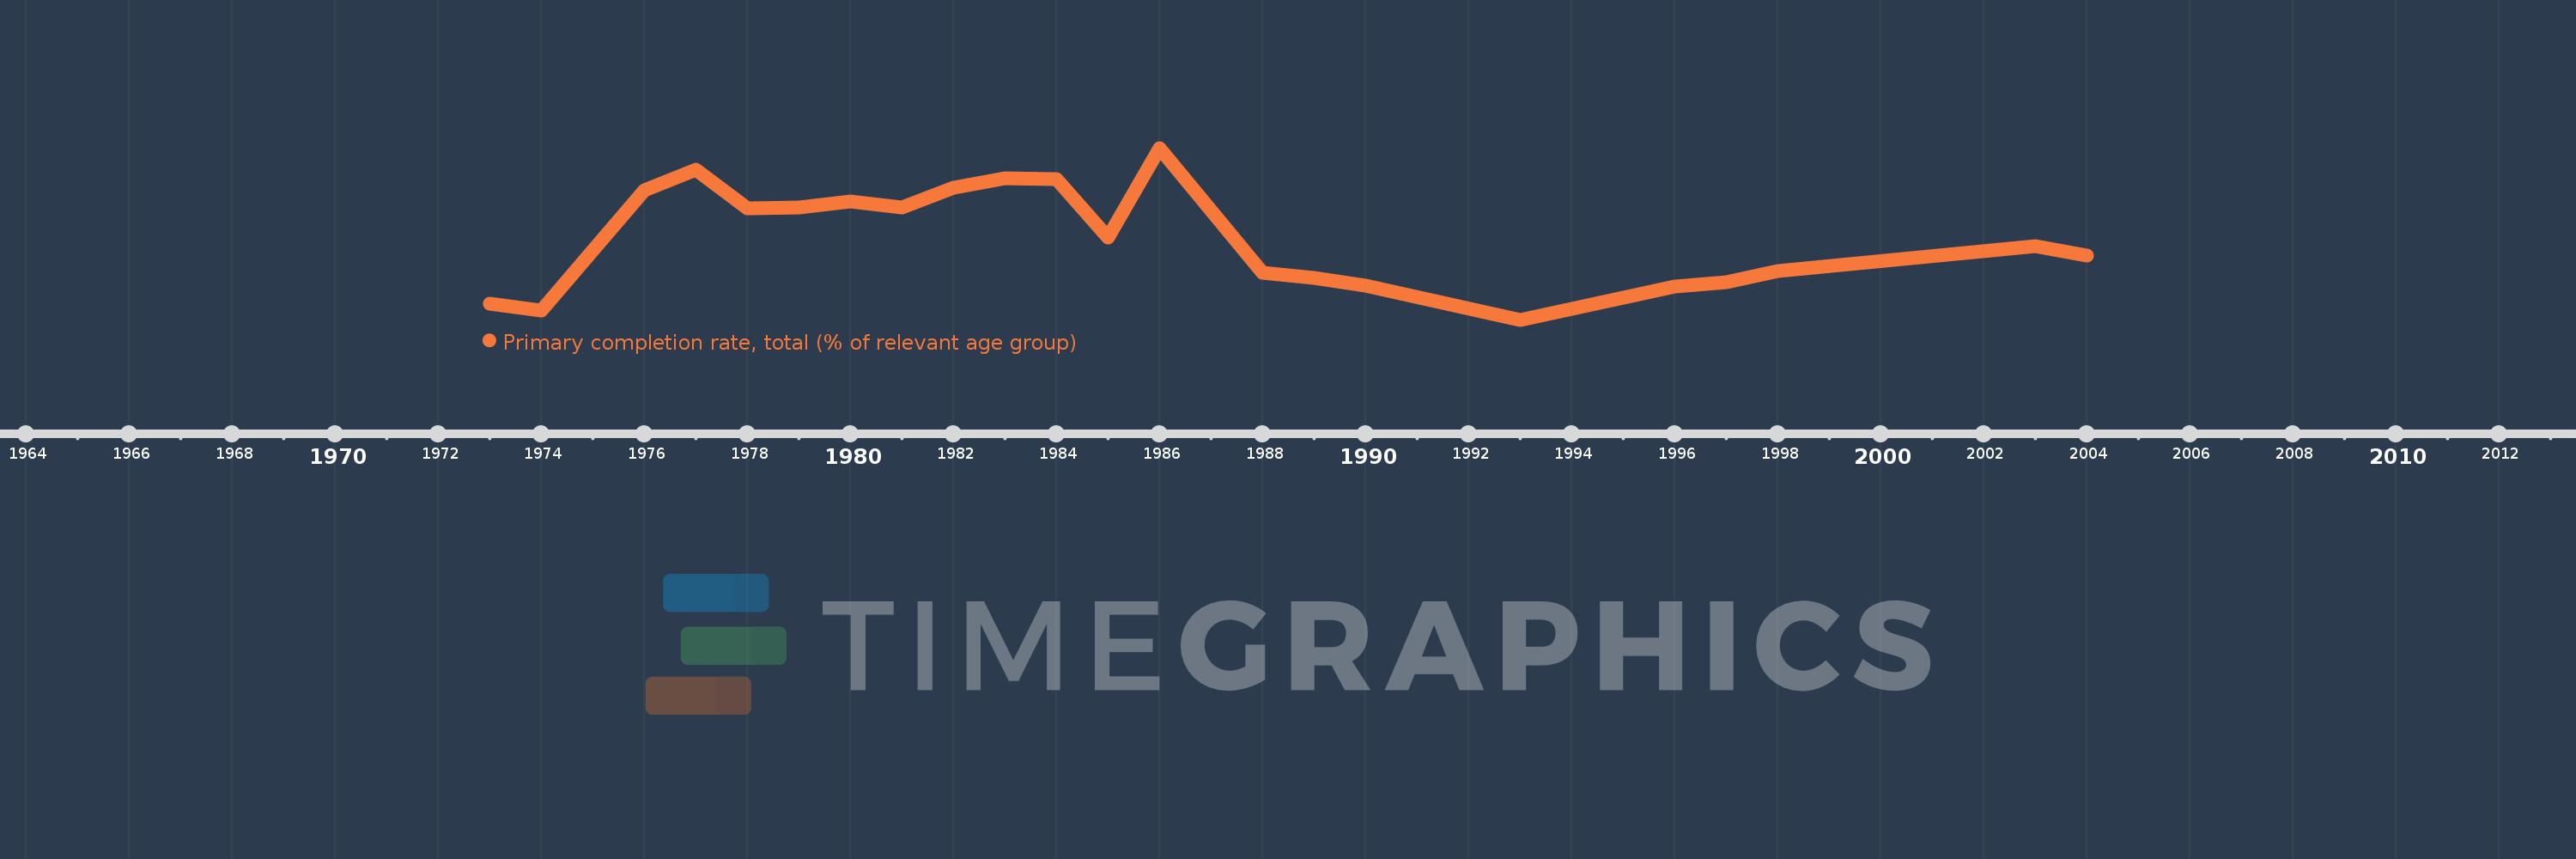
En esta escala de tiempo se presenta un gráfico de 1973 y 2004 de Gabon. Los datos de 1972 están ausentes. El número de observaciones reales por fecha: 22.

Fuente (nombre):

Indicadores del desarrollo mundial

Fuente (organización):

United Nations Educational, Scientific, and Cultural Organization (UNESCO) Institute for Statistics.

Categorías:

Aid Effectiveness, Climate Change, Education

Se ha actualizado:

23 abr 2017 año

Los indicadores de los cambios de valor en los últimos años

En promedio:
75.419
Mínimo:
59.706
1 ene 1993 año
Máximo:
92.56
1 ene 1986 año
A la fecha de observación
Valor
Cambio absoluto
El cambio con respecto al valor anterior
1 ene 1973 año
62.821
+62.821
0.0%
1 ene 1974 año
61.386
-1.435
-2.28%
1 ene 1976 año
84.535
+23.149
37.71%
1 ene 1977 año
88.423
+3.888
4.6%
1 ene 1978 año
80.969
-7.454
-8.43%
1 ene 1979 año
81.133
+0.165
0.2%
1 ene 1980 año
82.329
+1.195
1.47%
1 ene 1981 año
81.163
-1.166
-1.42%
1 ene 1982 año
84.93
+3.767
4.64%
1 ene 1983 año
86.757
+1.827
2.15%
1 ene 1984 año
86.542
-0.215
-0.25%
1 ene 1985 año
75.428
-11.115
-12.84%
1 ene 1986 año
92.56
+17.132
22.71%
1 ene 1988 año
68.743
-23.817
-25.73%
1 ene 1989 año
67.788
-0.955
-1.39%
1 ene 1990 año
66.275
-1.514
-2.23%
1 ene 1993 año
59.706
-6.569
-9.91%
1 ene 1996 año
66.074
+6.368
10.67%
1 ene 1997 año
66.814
+0.74
1.12%
1 ene 1998 año
69.08
+2.266
3.39%
1 ene 2003 año
73.855
+4.775
6.91%
1 ene 2004 año
71.905
-1.951
-2.64%

Ranking de los países por los datos estadísticos actuales