33
/es/
AIzaSyB4mHJ5NPEv-XzF7P6NDYXjlkCWaeKw5bc
November 30, 2025
135952
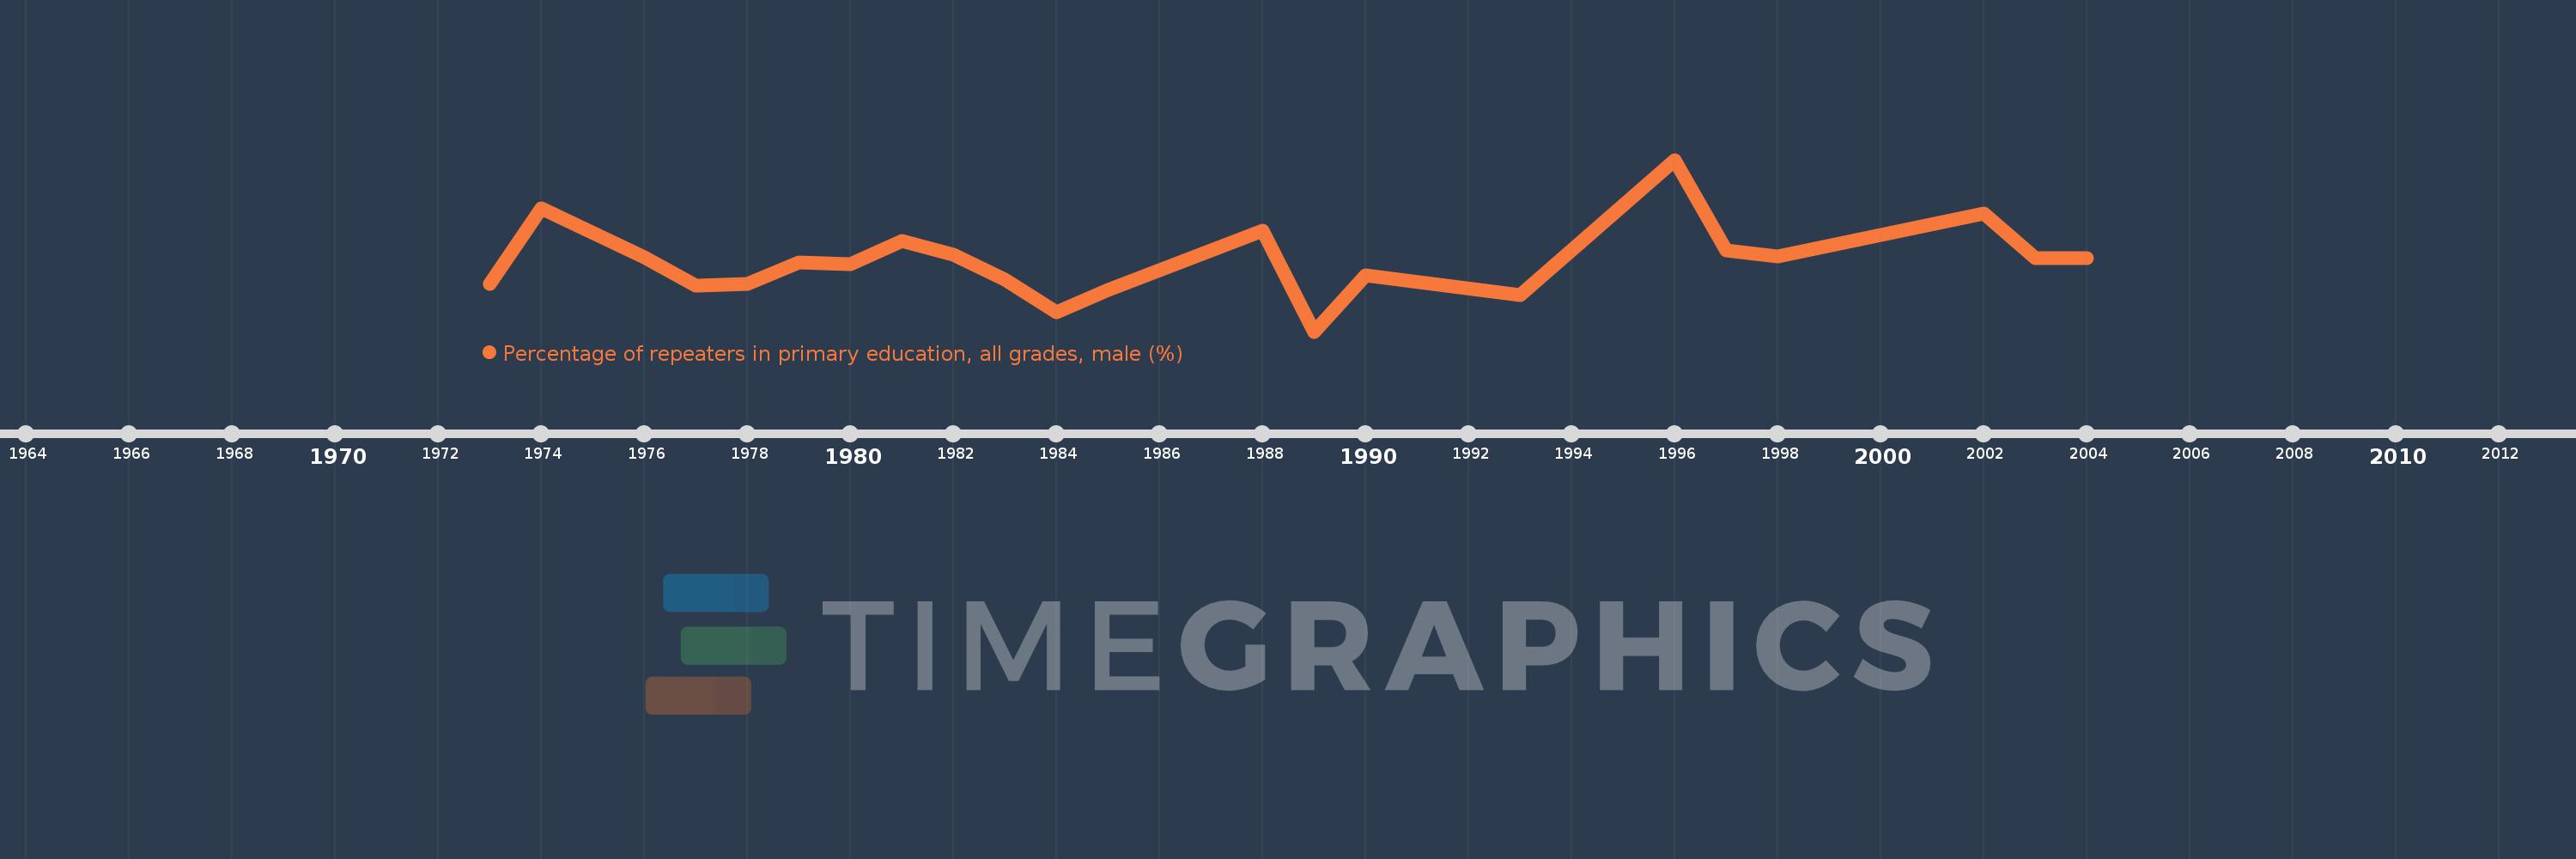
Gabon
GAB
true
2
1
Percentage of repeaters in primary education, all grades, male (%)
2004,2003,2002,1998,1997,1996,1993,1990,1989,1988,1985,1984,1983,1982,1981,1980,1979,1978,1977,1976,1974,1973