33
/es/
AIzaSyB4mHJ5NPEv-XzF7P6NDYXjlkCWaeKw5bc
November 1, 2025
123693
Ecuador
ECU
true
2
1
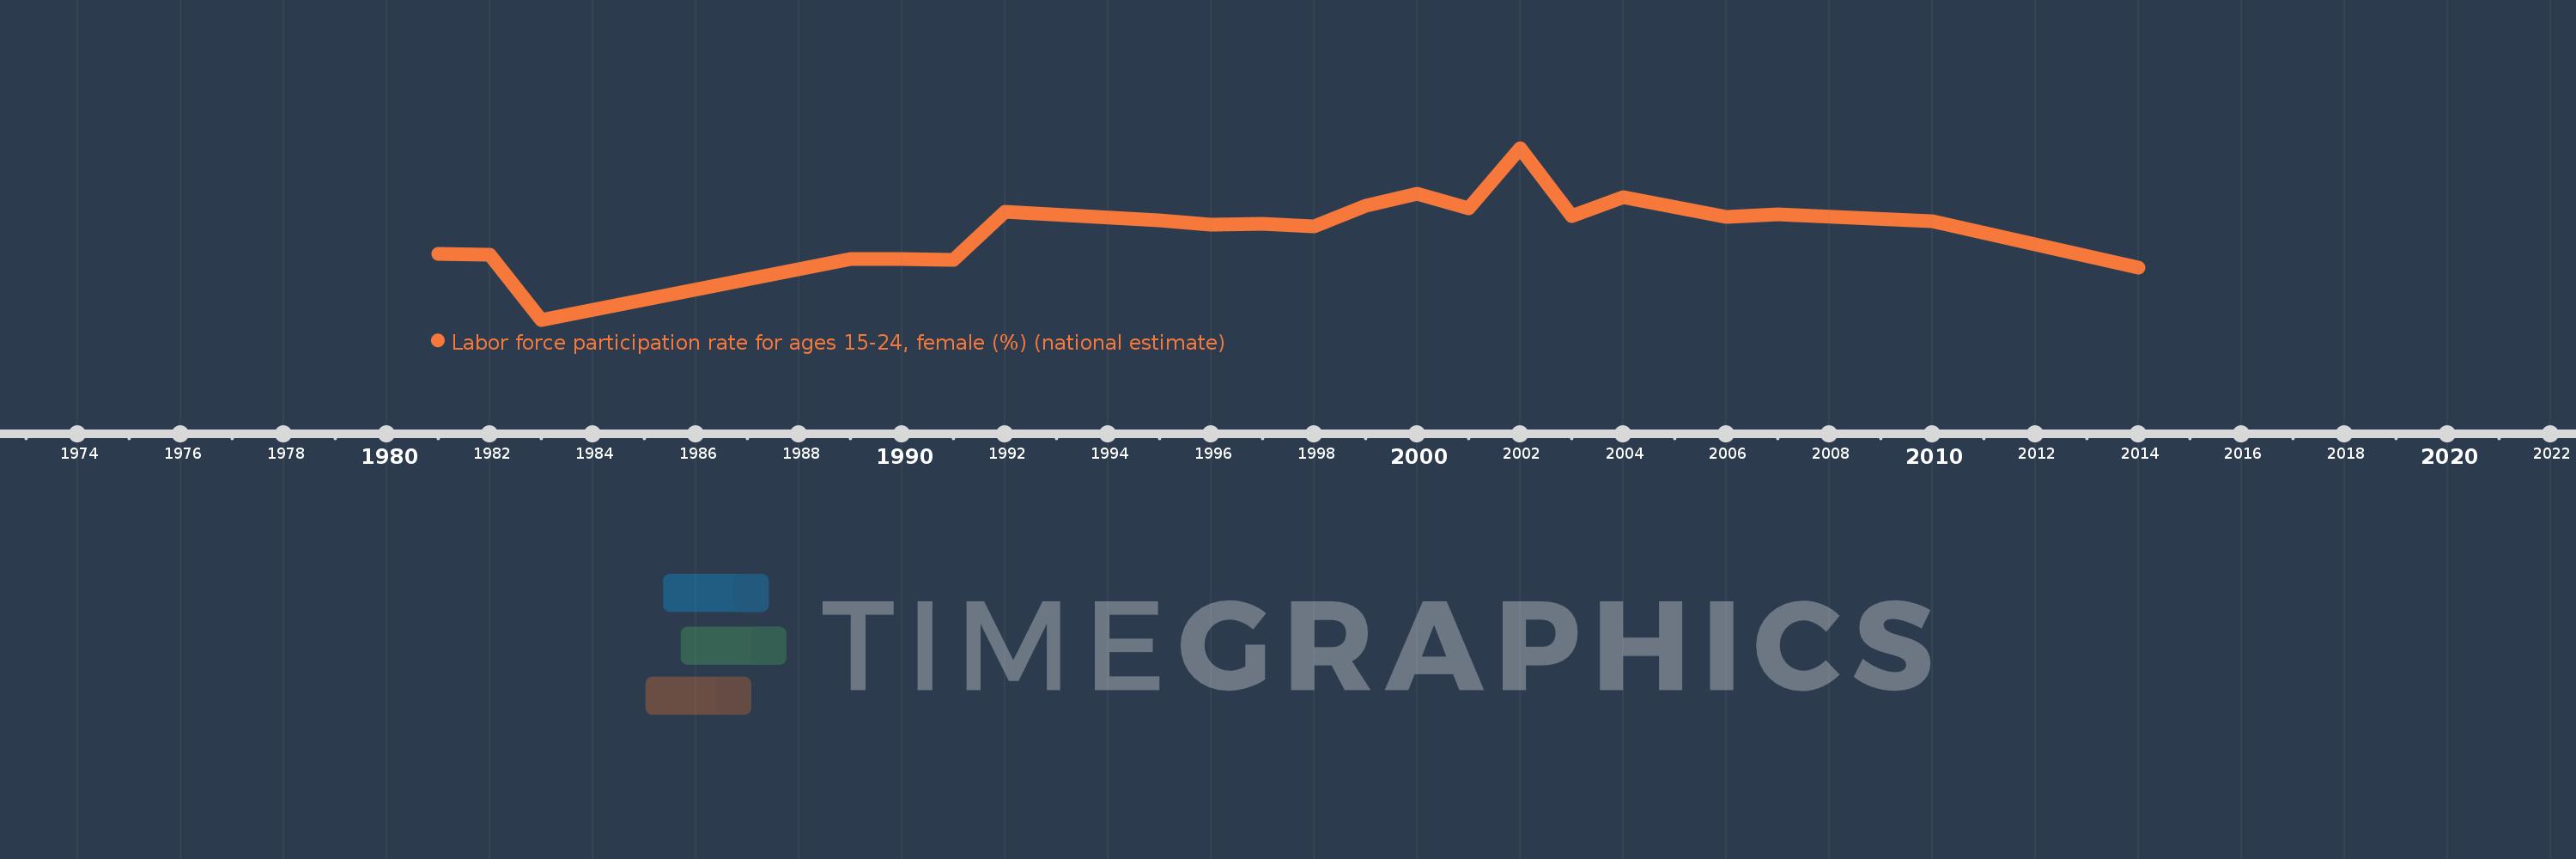
Labor force participation rate for ages 15-24, female (%) (national estimate)
2014,2010,2007,2006,2004,2003,2002,2001,2000,1999,1998,1997,1996,1995,1992,1991,1990,1989,1983,1982,1981