33
/es/
AIzaSyB4mHJ5NPEv-XzF7P6NDYXjlkCWaeKw5bc
November 1, 2025
119921
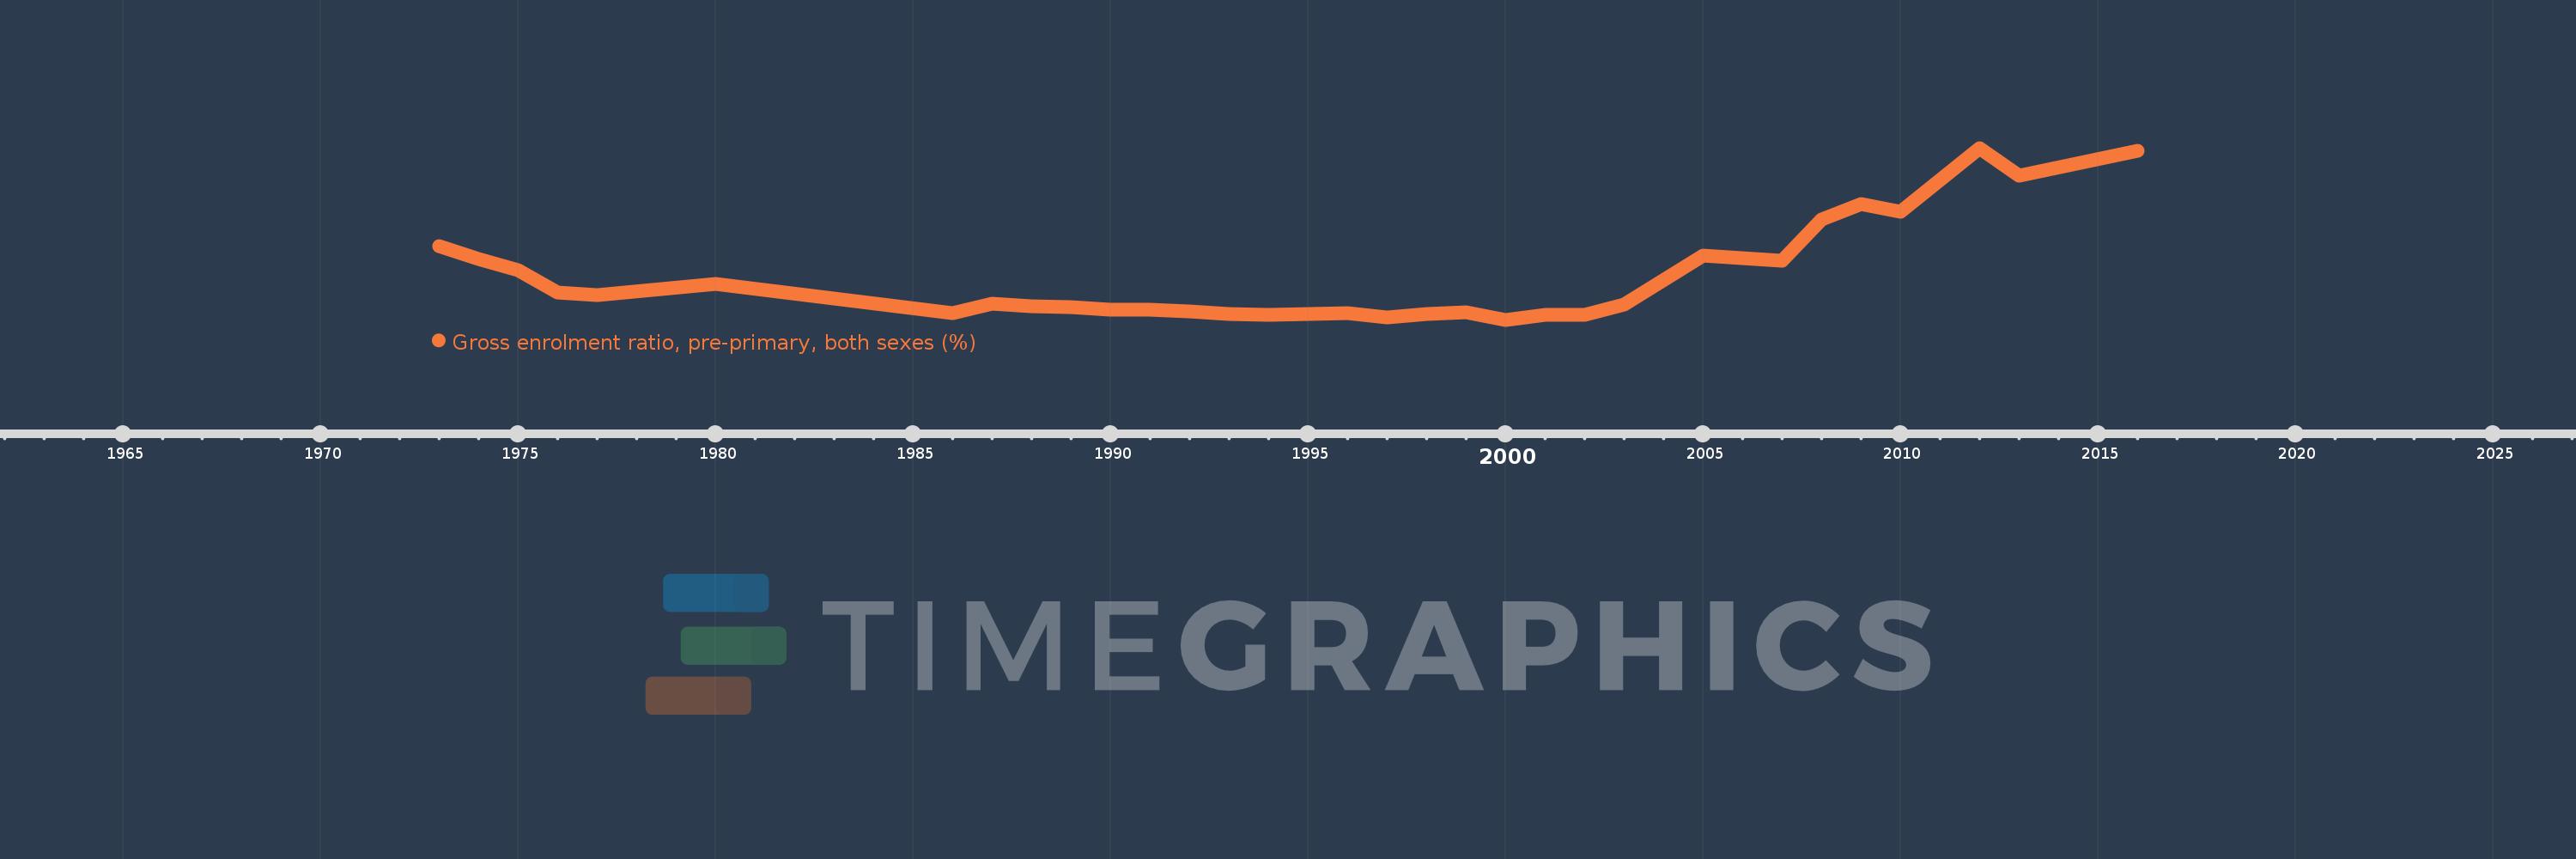
Djibouti
DJI
true
2
1
Gross enrolment ratio, pre-primary, both sexes (%)
2016,2013,2012,2010,2009,2008,2007,2005,2003,2002,2001,2000,1999,1998,1997,1996,1995,1994,1993,1992,1991,1990,1989,1988,1987,1986,1980,1977,1976,1975,1974,1973