29
/es/
es
AIzaSyAYiBZKx7MnpbEhh9jyipgxe19OcubqV5w
April 1, 2024
119139
Denmark
DNK
true
2
1
Manufacturing, value added (% of GDP)
2016,2015,2014,2013,2012,2011,2010,2009,2008,2007,2006,2005,2004,2003,2002,2001,2000,1999,1998,1997,1996,1995,1994,1993,1992,1991
Download
Estadísticas Globales de la Biblioteca →Denmark →

Manufacturing, value added (% of GDP)

Estas estadísticas en otros países:
AfghanistanAlbaniaAlgeriaAndorraAngolaAntigua and BarbudaArab WorldArgentinaArmeniaArubaAustraliaAustriaAzerbaijanBahamas, TheBahrainBangladeshBarbadosBelarusBelgiumBelizeBeninBermudaBhutanBoliviaBosnia and HerzegovinaBotswanaBrazilBrunei DarussalamBurkina FasoBurundiCabo VerdeCambodiaCameroonCanadaCaribbean small statesCayman IslandsCentral African RepublicCentral Europe and the BalticsChadChileChinaColombiaComorosCongo, Dem. Rep.Congo, Rep.Costa RicaCote d'IvoireCroatiaCubaCyprusCzech RepublicDenmarkDjiboutiDominicaDominican RepublicEarly-demographic dividendEast Asia & PacificEast Asia & Pacific (excluding high income)East Asia & Pacific (IDA & IBRD countries)EcuadorEgypt, Arab Rep.El SalvadorEquatorial GuineaEritreaEstoniaEthiopiaEuro areaEurope & Central AsiaEurope & Central Asia (excluding high income)Europe & Central Asia (IDA & IBRD countries)European UnionFaroe IslandsFijiFinlandFragile and conflict affected situationsFranceGabonGambia, TheGeorgiaGermanyGhanaGreeceGrenadaGuatemalaGuineaGuinea-BissauGuyanaHeavily indebted poor countries (HIPC)High incomeHondurasHong Kong SAR, ChinaHungaryIBRD onlyIcelandIDA & IBRD totalIDA blendIDA onlyIDA totalIndiaIndonesiaIran, Islamic Rep.IrelandItalyJamaicaJapanJordanKazakhstanKenyaKiribatiKorea, Rep.KosovoKuwaitKyrgyz RepublicLao PDRLate-demographic dividendLatin America & Caribbean Latin America & Caribbean (excluding high income)Latin America & the Caribbean (IDA & IBRD countries)LatviaLeast developed countries: UN classificationLebanonLesothoLibyaLithuaniaLow & middle incomeLow incomeLower middle incomeLuxembourgMacao SAR, ChinaMacedonia, FYRMadagascarMalawiMalaysiaMaldivesMaliMaltaMarshall IslandsMauritaniaMauritiusMexicoMicronesia, Fed. Sts.Middle East & North AfricaMiddle East & North Africa (excluding high income)Middle East & North Africa (IDA & IBRD countries)Middle incomeMoldovaMongoliaMontenegroMoroccoMozambiqueMyanmarNamibiaNepalNetherlandsNew CaledoniaNew ZealandNicaraguaNigerNigeriaNorth AmericaNorwayOECD membersOmanOther small statesPacific island small statesPakistanPalauPanamaPapua New GuineaParaguayPeruPhilippinesPolandPortugalPost-demographic dividendPre-demographic dividendPuerto RicoQatarRomaniaRussian FederationRwandaSao Tome and PrincipeSaudi ArabiaSenegalSerbiaSeychellesSierra LeoneSingaporeSlovak RepublicSloveniaSmall statesSolomon IslandsSomaliaSouth AfricaSouth AsiaSouth Asia (IDA & IBRD)SpainSri LankaSt. Kitts and NevisSt. LuciaSt. Vincent and the GrenadinesSub-Saharan Africa Sub-Saharan Africa (excluding high income)Sub-Saharan Africa (IDA & IBRD countries)SudanSurinameSwazilandSwedenSwitzerlandSyrian Arab RepublicTajikistanTanzaniaThailandTimor-LesteTogoTongaTrinidad and TobagoTunisiaTurkeyTurkmenistanTuvaluUgandaUkraineUnited KingdomUnited StatesUpper middle incomeUruguayUzbekistanVanuatuVenezuela, RBVietnamWest Bank and GazaWorldYemen, Rep.ZambiaZimbabwe
línea de tiempo (timeline):
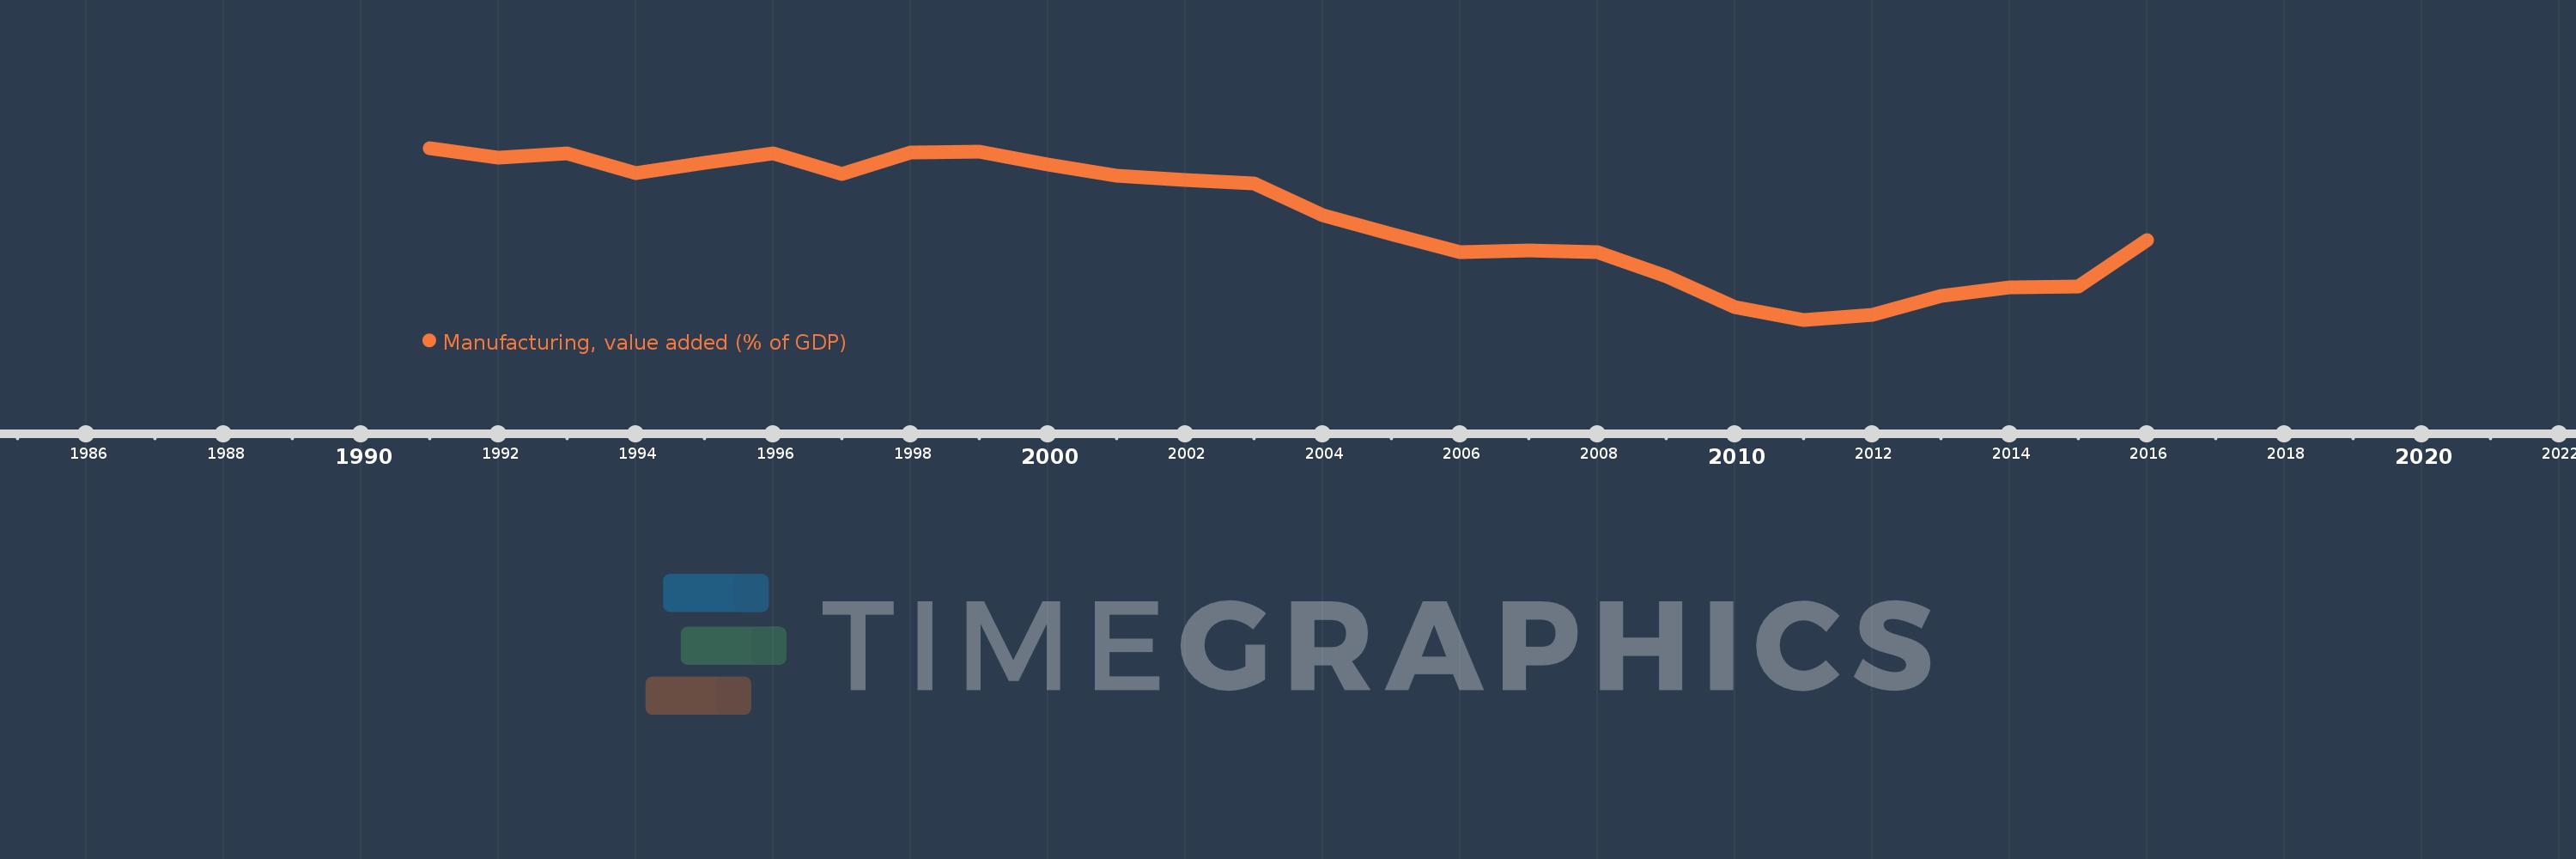
En esta escala de tiempo se presenta un gráfico de 1991 y 2016 de Denmark. Los datos de 1990 están ausentes. El número de observaciones reales por fecha: 26.
Fuente (nombre):
Indicadores del desarrollo mundial
Fuente (organización):
World Bank national accounts data, and OECD National Accounts data files.
Categorías:
Economy & Growth
Se ha actualizado:
23 abr 2017 año
Los indicadores de los cambios de valor en los últimos años
En promedio:
15.316
Mínimo:
12.641
1 ene 2011 año
Máximo:
17.15
1 ene 1991 año
A la fecha de observación
Valor
Cambio absoluto
El cambio con respecto al valor anterior
1 ene 1991 año
17.15
+17.15
0.0%
1 ene 1992 año
16.893
-0.257
-1.5%
1 ene 1993 año
17.012
+0.119
0.7%
1 ene 1994 año
16.493
-0.518
-3.05%
1 ene 1995 año
16.758
+0.265
1.61%
1 ene 1996 año
16.999
+0.24
1.43%
1 ene 1997 año
16.47
-0.528
-3.11%
1 ene 1998 año
17.035
+0.565
3.43%
1 ene 1999 año
17.049
+0.014
0.08%
1 ene 2000 año
16.709
-0.34
-1.99%
1 ene 2001 año
16.419
-0.29
-1.73%
1 ene 2002 año
16.299
-0.12
-0.73%
1 ene 2003 año
16.218
-0.082
-0.5%
1 ene 2004 año
15.39
-0.828
-5.11%
1 ene 2005 año
14.878
-0.512
-3.33%
1 ene 2006 año
14.423
-0.455
-3.06%
1 ene 2007 año
14.453
+0.031
0.21%
1 ene 2008 año
14.41
-0.043
-0.3%
1 ene 2009 año
13.778
-0.632
-4.39%
1 ene 2010 año
12.979
-0.799
-5.8%
1 ene 2011 año
12.641
-0.337
-2.6%
1 ene 2012 año
12.767
+0.125
0.99%
1 ene 2013 año
13.26
+0.494
3.87%
1 ene 2014 año
13.484
+0.224
1.69%
1 ene 2015 año
13.518
+0.034
0.25%
1 ene 2016 año
14.733
+1.215
8.99%
Ranking de los países por los datos estadísticos actuales

Comentarios:

Enviar
PremiumAbout & FeedbackAcuerdoPrivacidad
logo
© 2022 Selected Technologies LLC – Morgan Hill, California