33
/es/
AIzaSyAYiBZKx7MnpbEhh9jyipgxe19OcubqV5w
August 1, 2025
118232
Czech Republic
CZE
true
2
1
Net income from abroad (current LCU)
2016,2015,2014,2013,2012,2011,2010,2009,2008,2007,2006,2005,2004,2003,2002,2001,2000,1999,1998,1997,1996,1995,1994,1993
Download
Estadísticas Globales de la Biblioteca →Czech Republic →

Net income from abroad (current LCU)

Estas estadísticas en otros países:

AfghanistanAlbaniaAlgeriaAndorraAngolaAntigua and BarbudaArgentinaArmeniaAustraliaAustriaAzerbaijanBahamas, TheBahrainBangladeshBarbadosBelarusBelgiumBelizeBeninBermudaBhutanBoliviaBosnia and HerzegovinaBotswanaBrazilBrunei DarussalamBulgariaBurkina FasoBurundiCabo VerdeCambodiaCameroonCanadaCentral African RepublicChadChannel IslandsChileChinaColombiaComorosCongo, Dem. Rep.Congo, Rep.Costa RicaCote d'IvoireCroatiaCubaCyprusCzech RepublicDenmarkDjiboutiDominicaDominican RepublicEcuadorEgypt, Arab Rep.El SalvadorEquatorial GuineaEritreaEstoniaEthiopiaFaroe IslandsFijiFinlandFranceFrench PolynesiaGabonGambia, TheGeorgiaGermanyGhanaGreeceGreenlandGrenadaGuatemalaGuineaGuinea-BissauGuyanaHaitiHondurasHong Kong SAR, ChinaHungaryIcelandIndiaIndonesiaIran, Islamic Rep.IraqIrelandIsraelItalyJamaicaJapanJordanKazakhstanKenyaKiribatiKorea, Rep.KosovoKuwaitKyrgyz RepublicLao PDRLatviaLebanonLesothoLiberiaLibyaLithuaniaLuxembourgMacao SAR, ChinaMacedonia, FYRMadagascarMalawiMalaysiaMaldivesMaliMaltaMarshall IslandsMauritaniaMauritiusMexicoMicronesia, Fed. Sts.MoldovaMonacoMongoliaMontenegroMoroccoMozambiqueMyanmarNamibiaNepalNetherlandsNew CaledoniaNew ZealandNicaraguaNigerNigeriaNorwayOmanPakistanPalauPanamaPapua New GuineaParaguayPeruPhilippinesPolandPortugalPuerto RicoQatarRomaniaRussian FederationRwandaSamoaSao Tome and PrincipeSaudi ArabiaSenegalSerbiaSeychellesSierra LeoneSingaporeSlovak RepublicSloveniaSolomon IslandsSomaliaSouth AfricaSouth SudanSpainSri LankaSt. Kitts and NevisSt. LuciaSt. Vincent and the GrenadinesSudanSurinameSwazilandSwedenSwitzerlandSyrian Arab RepublicTajikistanTanzaniaThailandTimor-LesteTogoTongaTrinidad and TobagoTunisiaTurkeyTurkmenistanTuvaluUgandaUkraineUnited Arab EmiratesUnited KingdomUnited StatesUruguayUzbekistanVanuatuVenezuela, RBVietnamVirgin Islands (U.S.)West Bank and GazaYemen, Rep.ZambiaZimbabwe

línea de tiempo (timeline):

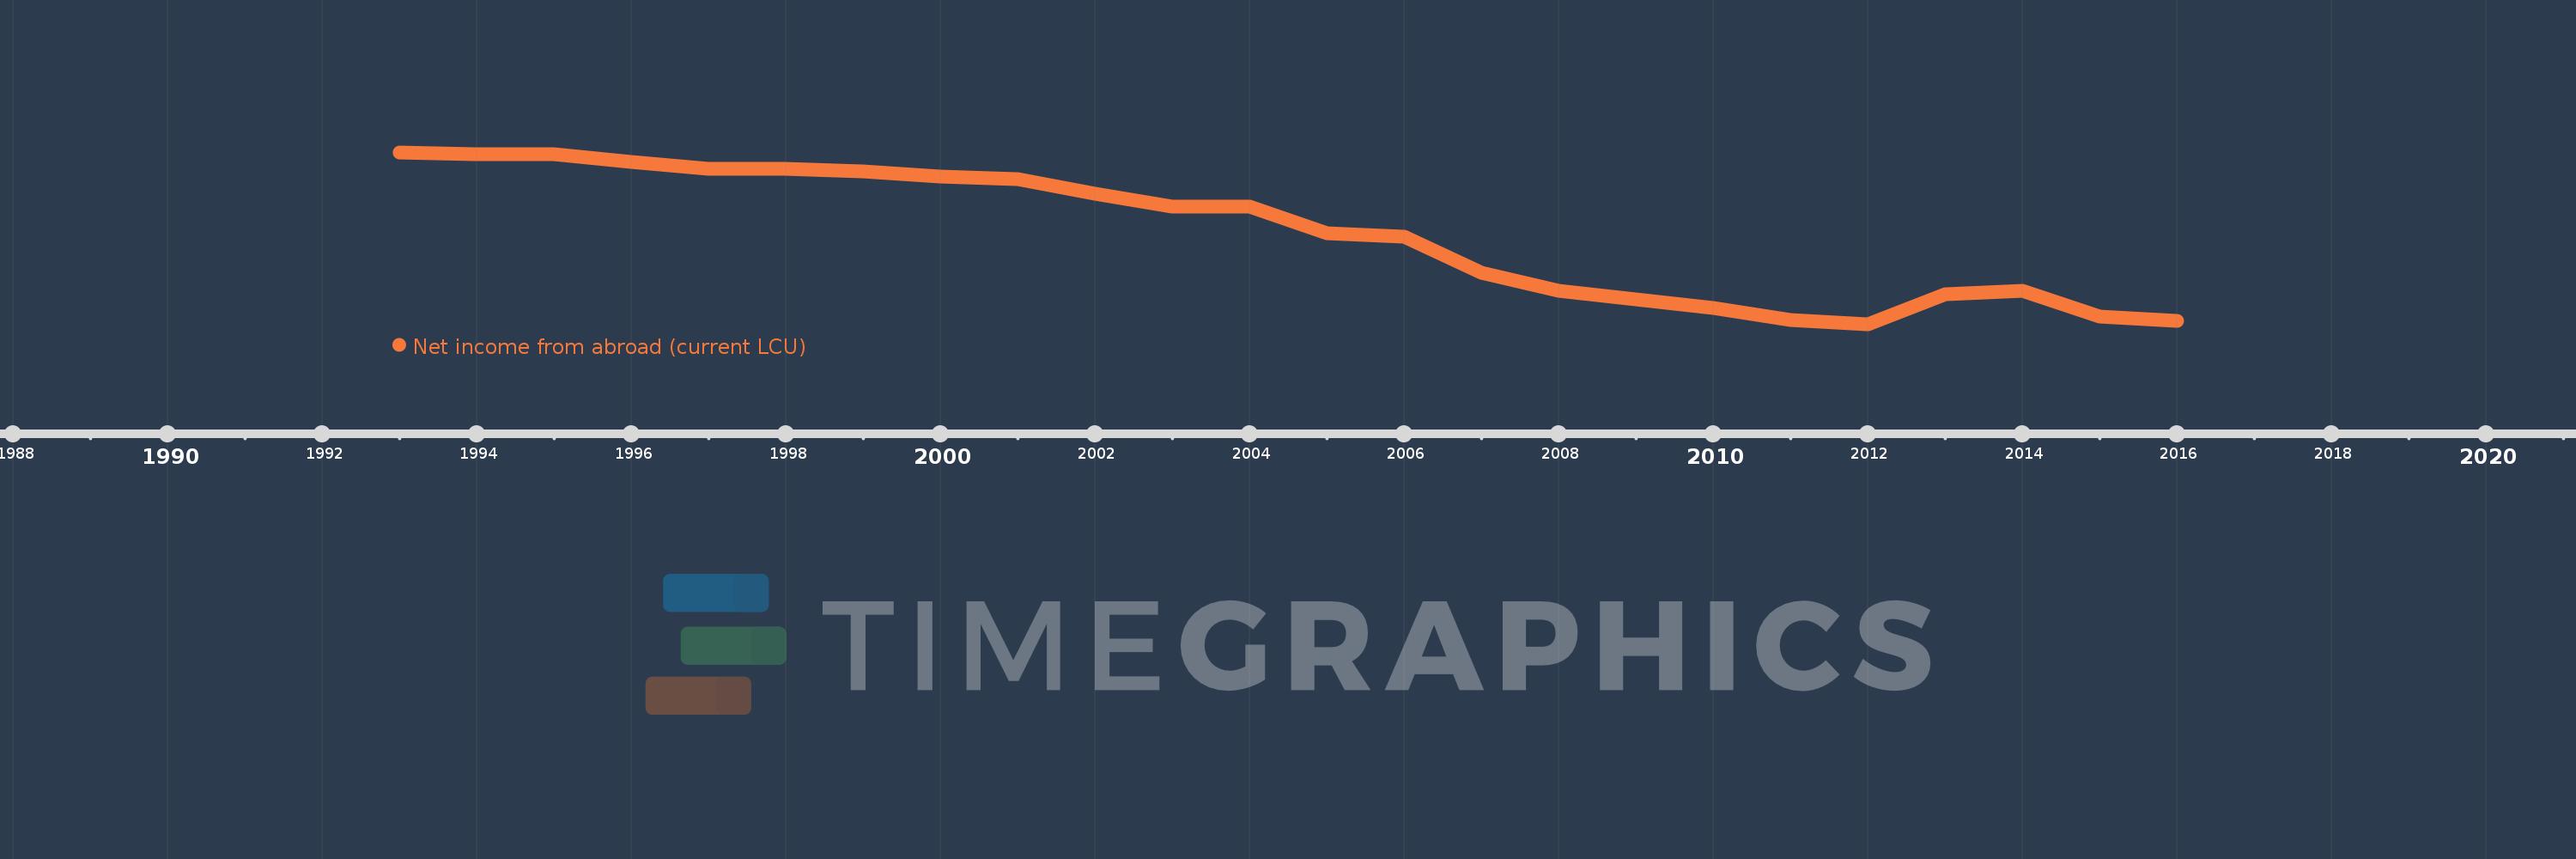
En esta escala de tiempo se presenta un gráfico de 1993 y 2016 de Czech Republic. Los datos de 1992 están ausentes. El número de observaciones reales por fecha: 24.

Fuente (nombre):

Indicadores del desarrollo mundial

Fuente (organización):

World Bank national accounts data, and OECD National Accounts data files.

Categorías:

Economy & Growth

Se ha actualizado:

23 abr 2017 año

Los indicadores de los cambios de valor en los últimos años

En promedio:
-141.348 bn
Mínimo:
-305.473 bn
1 ene 2012 año
Máximo:
4.845 bn
1 ene 1993 año
A la fecha de observación
Valor
Cambio absoluto
El cambio con respecto al valor anterior
1 ene 1993 año
4.845 bn
+4.845 bn
0.0%
1 ene 1994 año
1.637 bn
-3.208 bn
-66.21%
1 ene 1995 año
1.775 bn
+137.553 millones
8.4%
1 ene 1996 año
-11.61 bn
-13.385 bn
-754.17%
1 ene 1997 año
-24.122 bn
-12.512 bn
107.77%
1 ene 1998 año
-25.13 bn
-1.008 bn
4.18%
1 ene 1999 año
-28.718 bn
-3.588 bn
14.28%
1 ene 2000 año
-38.97 bn
-10.252 bn
35.7%
1 ene 2001 año
-43.527 bn
-4.557 bn
11.69%
1 ene 2002 año
-69.904 bn
-26.377 bn
60.6%
1 ene 2003 año
-92.937 bn
-23.033 bn
32.95%
1 ene 2004 año
-93.024 bn
-87.0 millones
0.09%
1 ene 2005 año
-140.802 bn
-47.778 bn
51.36%
1 ene 2006 año
-147.329 bn
-6.527 bn
4.64%
1 ene 2007 año
-212.809 bn
-65.48 bn
44.44%
1 ene 2008 año
-245.142 bn
-32.333 bn
15.19%
1 ene 2009 año
-260.552 bn
-15.41 bn
6.29%
1 ene 2010 año
-276.117 bn
-15.565 bn
5.97%
1 ene 2011 año
-297.393 bn
-21.276 bn
7.71%
1 ene 2012 año
-305.473 bn
-8.08 bn
2.72%
1 ene 2013 año
-251.57 bn
+53.903 bn
-17.65%
1 ene 2014 año
-244.607 bn
+6.963 bn
-2.77%
1 ene 2015 año
-291.511 bn
-46.904 bn
19.18%
1 ene 2016 año
-299.368 bn
-7.857 bn
2.7%

Ranking de los países por los datos estadísticos actuales