33
/es/
AIzaSyAYiBZKx7MnpbEhh9jyipgxe19OcubqV5w
August 1, 2025
115241
Croatia
HRV
true
2
1
Permanent cropland (% of land area)
2015,2014,2013,2012,2011,2010,2009,2008,2007,2006,2005,2004,2003,2002,2001,2000,1999,1998,1997,1996,1995,1994,1993
Download
Estadísticas Globales de la Biblioteca →Croatia →

Permanent cropland (% of land area)

Estas estadísticas en otros países:

AfghanistanAlbaniaAlgeriaAmerican SamoaAngolaAntigua and BarbudaArab WorldArgentinaArmeniaAustraliaAustriaAzerbaijanBahamas, TheBahrainBangladeshBarbadosBelarusBelgiumBelizeBeninBhutanBoliviaBosnia and HerzegovinaBotswanaBrazilBritish Virgin IslandsBrunei DarussalamBulgariaBurkina FasoBurundiCabo VerdeCambodiaCameroonCanadaCaribbean small statesCayman IslandsCentral African RepublicCentral Europe and the BalticsChadChileChinaColombiaComorosCongo, Dem. Rep.Congo, Rep.Costa RicaCote d'IvoireCroatiaCubaCyprusCzech RepublicDenmarkDominicaDominican RepublicEarly-demographic dividendEast Asia & PacificEast Asia & Pacific (excluding high income)East Asia & Pacific (IDA & IBRD countries)EcuadorEgypt, Arab Rep.El SalvadorEquatorial GuineaEritreaEstoniaEthiopiaEuro areaEurope & Central AsiaEurope & Central Asia (excluding high income)Europe & Central Asia (IDA & IBRD countries)European UnionFijiFinlandFragile and conflict affected situationsFranceFrench PolynesiaGabonGambia, TheGeorgiaGermanyGhanaGreeceGrenadaGuamGuatemalaGuineaGuinea-BissauGuyanaHaitiHeavily indebted poor countries (HIPC)High incomeHondurasHong Kong SAR, ChinaHungaryIBRD onlyIDA & IBRD totalIDA blendIDA onlyIDA totalIndiaIndonesiaIran, Islamic Rep.IraqIrelandIsraelItalyJamaicaJapanJordanKazakhstanKenyaKiribatiKorea, Dem. People’s Rep.Korea, Rep.KuwaitKyrgyz RepublicLao PDRLate-demographic dividendLatin America & Caribbean Latin America & Caribbean (excluding high income)Latin America & the Caribbean (IDA & IBRD countries)LatviaLeast developed countries: UN classificationLebanonLesothoLiberiaLibyaLithuaniaLow & middle incomeLow incomeLower middle incomeLuxembourgMacedonia, FYRMadagascarMalawiMalaysiaMaldivesMaliMaltaMarshall IslandsMauritaniaMauritiusMexicoMicronesia, Fed. Sts.Middle East & North AfricaMiddle East & North Africa (excluding high income)Middle East & North Africa (IDA & IBRD countries)Middle incomeMoldovaMongoliaMontenegroMoroccoMozambiqueMyanmarNamibiaNauruNepalNetherlandsNew CaledoniaNew ZealandNicaraguaNigerNigeriaNorth AmericaNorthern Mariana IslandsNorwayOECD membersOmanOther small statesPacific island small statesPakistanPalauPanamaPapua New GuineaParaguayPeruPhilippinesPolandPortugalPost-demographic dividendPre-demographic dividendPuerto RicoQatarRomaniaRussian FederationRwandaSamoaSao Tome and PrincipeSaudi ArabiaSenegalSerbiaSeychellesSierra LeoneSingaporeSlovak RepublicSloveniaSmall statesSolomon IslandsSomaliaSouth AfricaSouth AsiaSouth Asia (IDA & IBRD)SpainSri LankaSt. Kitts and NevisSt. LuciaSt. Vincent and the GrenadinesSub-Saharan Africa Sub-Saharan Africa (excluding high income)Sub-Saharan Africa (IDA & IBRD countries)SudanSurinameSwazilandSwedenSwitzerlandSyrian Arab RepublicTajikistanTanzaniaThailandTimor-LesteTogoTongaTrinidad and TobagoTunisiaTurkeyTurkmenistanTuvaluUgandaUkraineUnited Arab EmiratesUnited KingdomUnited StatesUpper middle incomeUruguayUzbekistanVanuatuVenezuela, RBVietnamVirgin Islands (U.S.)West Bank and GazaWorldYemen, Rep.ZambiaZimbabwe

línea de tiempo (timeline):

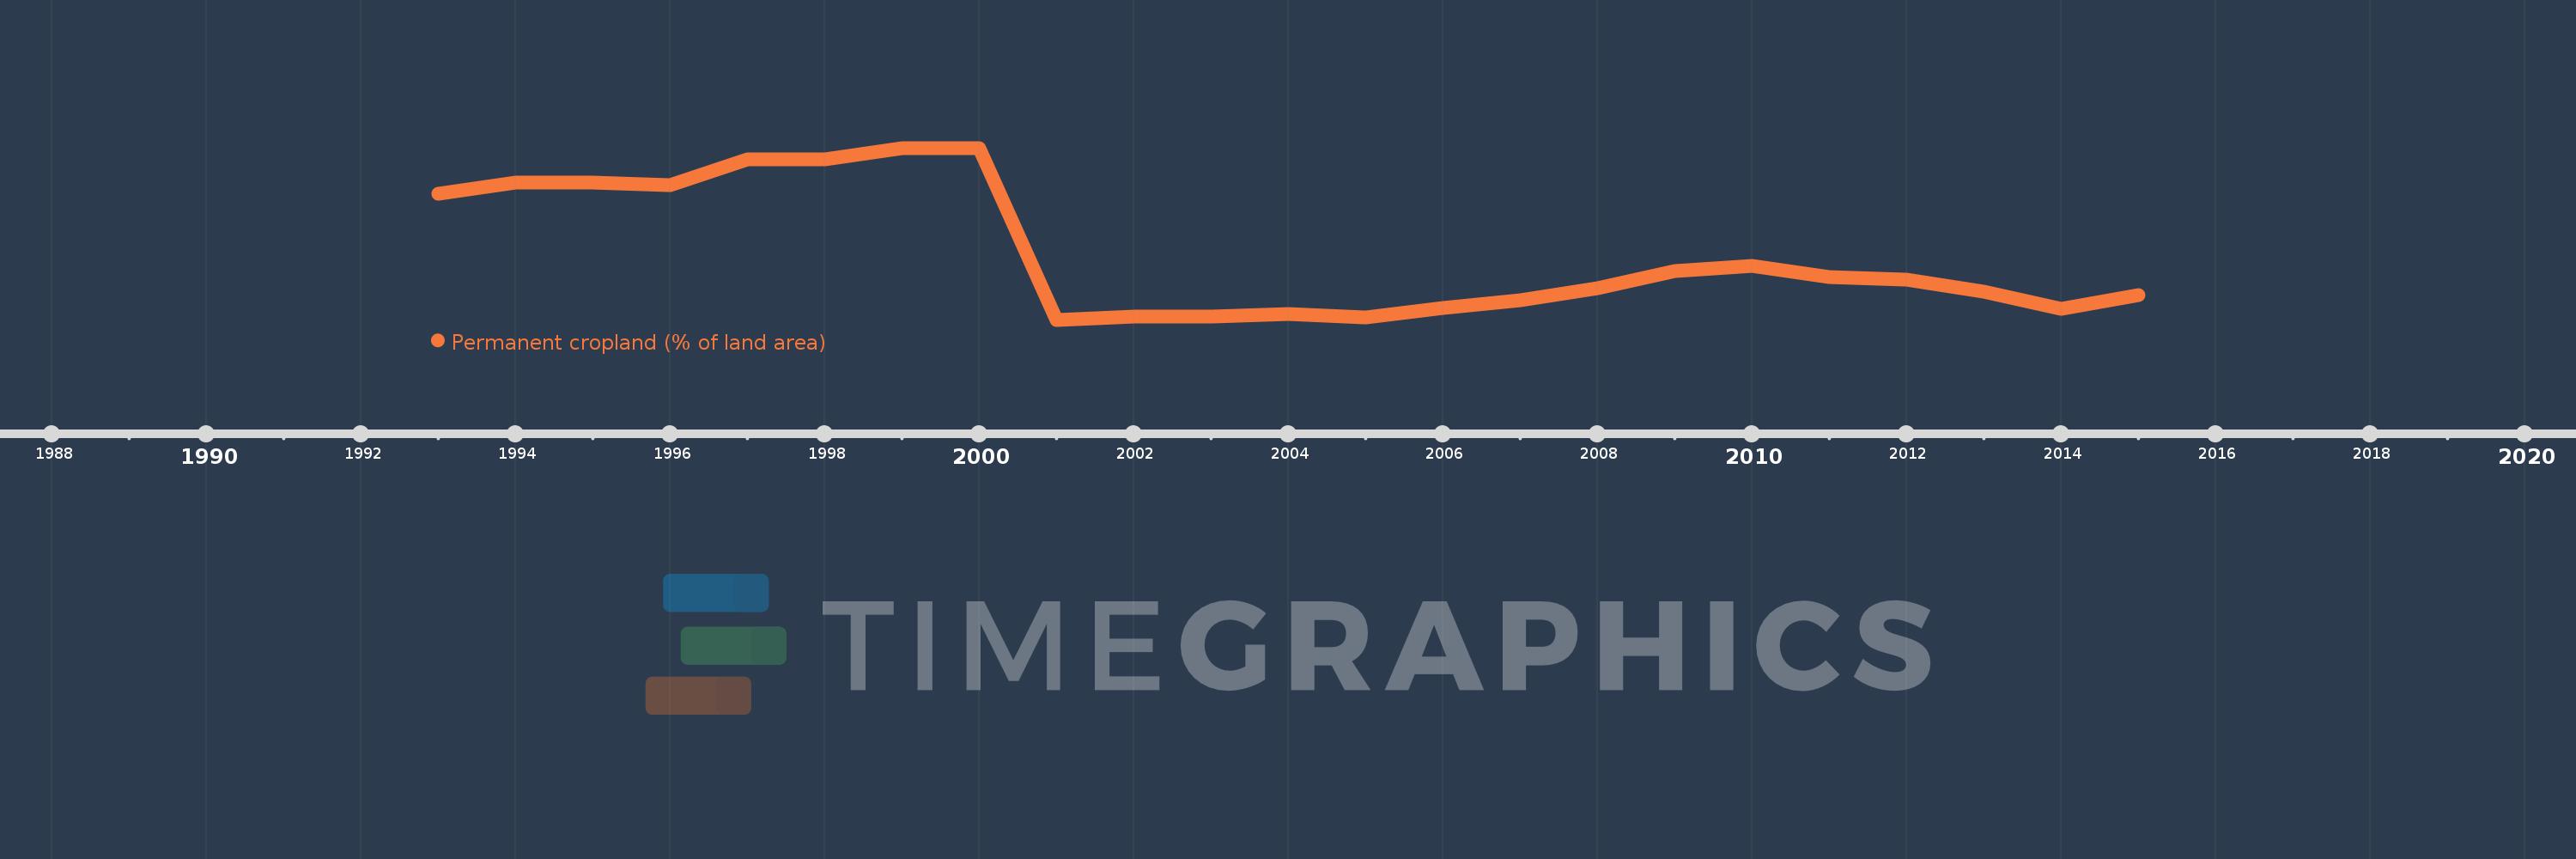
En esta escala de tiempo se presenta un gráfico de 1993 y 2015 de Croatia. Los datos de 1992 están ausentes. El número de observaciones reales por fecha: 23.

Fuente (nombre):

Indicadores del desarrollo mundial

Fuente (organización):

Food and Agriculture Organization, electronic files and web site.

Categorías:

Agriculture & Rural Development

Se ha actualizado:

23 abr 2017 año

Los indicadores de los cambios de valor en los últimos años

En promedio:
1.648
Mínimo:
1.234
1 ene 2001 año
Máximo:
2.307
1 ene 1999 año
A la fecha de observación
Valor
Cambio absoluto
El cambio con respecto al valor anterior
1 ene 1993 año
2.021
+2.021
0.0%
1 ene 1994 año
2.093
+0.072
3.54%
1 ene 1995 año
2.093
0.0
0.0%
1 ene 1996 año
2.075
-0.018
-0.85%
1 ene 1997 año
2.233
+0.158
7.62%
1 ene 1998 año
2.233
0.0
0.0%
1 ene 1999 año
2.307
+0.074
3.33%
1 ene 2000 año
2.307
0.0
0.0%
1 ene 2001 año
1.234
-1.073
-46.51%
1 ene 2002 año
1.252
+0.018
1.45%
1 ene 2003 año
1.252
0.0
0.0%
1 ene 2004 año
1.27
+0.018
1.43%
1 ene 2005 año
1.251
-0.019
-1.5%
1 ene 2006 año
1.305
+0.054
4.29%
1 ene 2007 año
1.358
+0.054
4.11%
1 ene 2008 año
1.43
+0.071
5.26%
1 ene 2009 año
1.537
+0.107
7.5%
1 ene 2010 año
1.573
+0.036
2.33%
1 ene 2011 año
1.501
-0.071
-4.55%
1 ene 2012 año
1.483
-0.018
-1.19%
1 ene 2013 año
1.412
-0.071
-4.82%
1 ene 2014 año
1.303
-0.109
-7.72%
1 ene 2015 año
1.387
+0.084
6.45%

Ranking de los países por los datos estadísticos actuales