29
/es/
es
AIzaSyAYiBZKx7MnpbEhh9jyipgxe19OcubqV5w
April 1, 2024
114749
Croatia
HRV
true
2
1
External balance on goods and services (current LCU)
2016,2015,2014,2013,2012,2011,2010,2009,2008,2007,2006,2005,2004,2003,2002,2001,2000,1999,1998,1997,1996
Download
Estadísticas Globales de la Biblioteca →Croatia →

External balance on goods and services (current LCU)

Estas estadísticas en otros países:
AfghanistanAlbaniaAlgeriaAngolaAntigua and BarbudaArgentinaArmeniaArubaAustraliaAustriaAzerbaijanBahamas, TheBahrainBangladeshBarbadosBelarusBelgiumBelizeBeninBermudaBhutanBoliviaBosnia and HerzegovinaBotswanaBrazilBrunei DarussalamBulgariaBurkina FasoBurundiCabo VerdeCambodiaCameroonCanadaCentral African RepublicChadChileChinaColombiaComorosCongo, Dem. Rep.Congo, Rep.Costa RicaCote d'IvoireCroatiaCubaCyprusCzech RepublicDenmarkDjiboutiDominicaDominican RepublicEcuadorEgypt, Arab Rep.El SalvadorEquatorial GuineaEritreaEstoniaEthiopiaFaroe IslandsFijiFinlandFranceFrench PolynesiaGabonGambia, TheGeorgiaGermanyGhanaGreeceGrenadaGuatemalaGuineaGuinea-BissauGuyanaHaitiHondurasHong Kong SAR, ChinaHungaryIcelandIndiaIndonesiaIran, Islamic Rep.IraqIrelandIsraelItalyJamaicaJapanJordanKazakhstanKenyaKiribatiKorea, Rep.KosovoKuwaitKyrgyz RepublicLao PDRLatviaLebanonLesothoLiberiaLibyaLithuaniaLuxembourgMacao SAR, ChinaMacedonia, FYRMadagascarMalawiMalaysiaMaldivesMaliMaltaMauritaniaMauritiusMexicoMicronesia, Fed. Sts.MoldovaMongoliaMontenegroMoroccoMozambiqueMyanmarNamibiaNepalNetherlandsNew CaledoniaNew ZealandNicaraguaNigerNigeriaNorwayOmanPakistanPalauPanamaPapua New GuineaParaguayPeruPhilippinesPolandPortugalPuerto RicoQatarRomaniaRussian FederationRwandaSamoaSaudi ArabiaSenegalSerbiaSeychellesSierra LeoneSingaporeSlovak RepublicSloveniaSolomon IslandsSomaliaSouth AfricaSouth SudanSpainSri LankaSt. Kitts and NevisSt. LuciaSt. Vincent and the GrenadinesSudanSurinameSwazilandSwedenSwitzerlandSyrian Arab RepublicTajikistanTanzaniaThailandTimor-LesteTogoTongaTrinidad and TobagoTunisiaTurkeyTurkmenistanUgandaUkraineUnited Arab EmiratesUnited KingdomUnited StatesUruguayUzbekistanVanuatuVenezuela, RBVietnamWest Bank and GazaYemen, Rep.ZambiaZimbabwe
línea de tiempo (timeline):
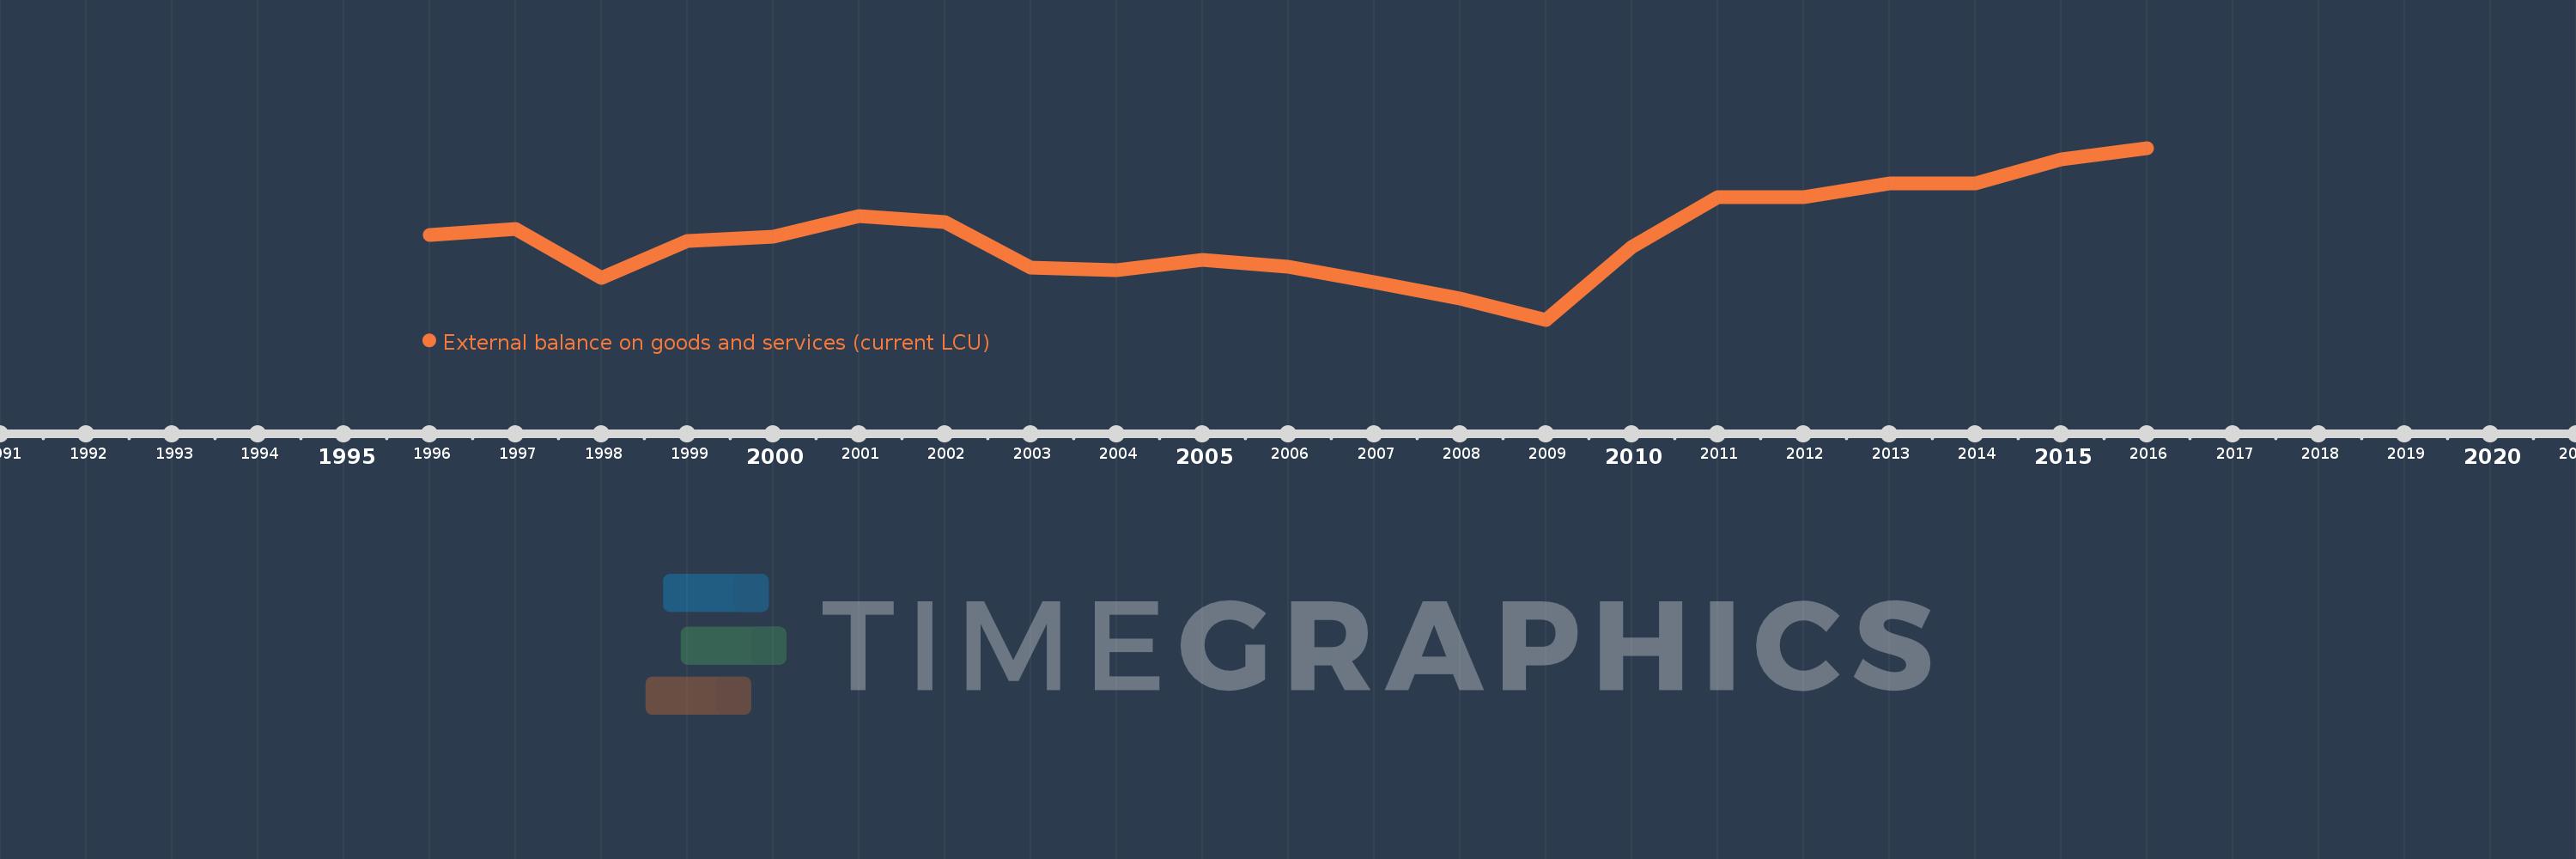
En esta escala de tiempo se presenta un gráfico de 1996 y 2016 de Croatia. Los datos de 1995 están ausentes. El número de observaciones reales por fecha: 21.
Fuente (nombre):
Indicadores del desarrollo mundial
Fuente (organización):
World Bank national accounts data, and OECD National Accounts data files.
Categorías:
Economy & Growth
Se ha actualizado:
23 abr 2017 año
Los indicadores de los cambios de valor en los últimos años
En promedio:
-9.693 bn
Mínimo:
-27.954 bn
1 ene 2009 año
Máximo:
9.156 bn
1 ene 2016 año
A la fecha de observación
Valor
Cambio absoluto
El cambio con respecto al valor anterior
1 ene 1996 año
-9.699 bn
-9.699 bn
0.0%
1 ene 1997 año
-8.402 bn
+1.297 bn
-13.38%
1 ene 1998 año
-18.944 bn
-10.543 bn
125.49%
1 ene 1999 año
-10.991 bn
+7.953 bn
-41.98%
1 ene 2000 año
-10.068 bn
+923.844 millones
-8.41%
1 ene 2001 año
-5.492 bn
+4.576 bn
-45.45%
1 ene 2002 año
-6.838 bn
-1.347 bn
24.52%
1 ene 2003 año
-16.664 bn
-9.826 bn
143.69%
1 ene 2004 año
-17.287 bn
-622.691 millones
3.74%
1 ene 2005 año
-15.093 bn
+2.194 bn
-12.69%
1 ene 2006 año
-16.581 bn
-1.488 bn
9.86%
1 ene 2007 año
-19.843 bn
-3.262 bn
19.67%
1 ene 2008 año
-23.424 bn
-3.581 bn
18.05%
1 ene 2009 año
-27.954 bn
-4.531 bn
19.34%
1 ene 2010 año
-12.296 bn
+15.658 bn
-56.01%
1 ene 2011 año
-1.387 bn
+10.909 bn
-88.72%
1 ene 2012 año
-1.537 bn
-150.404 millones
10.85%
1 ene 2013 año
1.564 bn
+3.101 bn
-201.72%
1 ene 2014 año
1.526 bn
-37.362 millones
-2.39%
1 ene 2015 año
6.7 bn
+5.174 bn
338.98%
1 ene 2016 año
9.156 bn
+2.456 bn
36.66%
Ranking de los países por los datos estadísticos actuales

Comentarios:

Enviar
PremiumAbout & FeedbackAcuerdoPrivacidad
logo
© 2022 Selected Technologies LLC – Morgan Hill, California