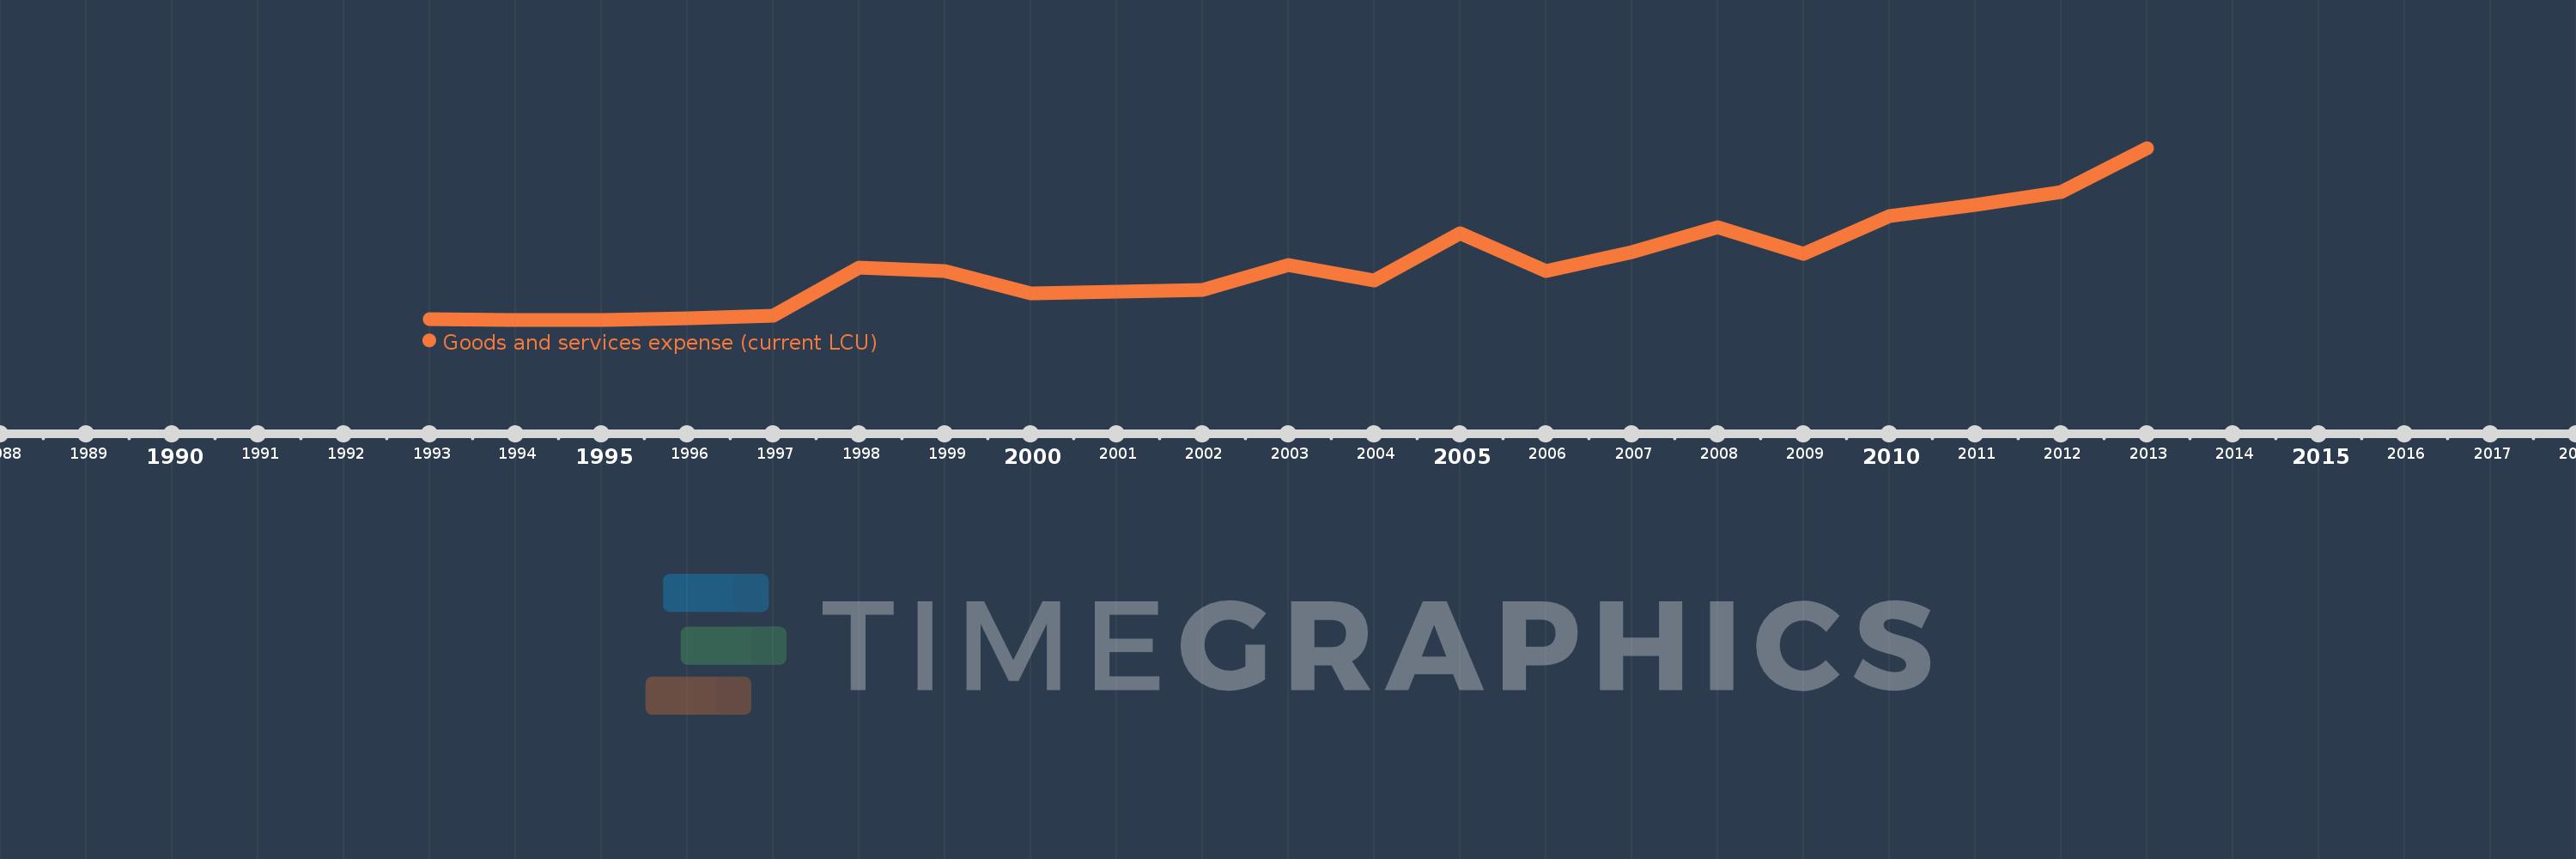
En esta escala de tiempo se presenta un gráfico de 1993 y 2013 de Congo, Rep.. Los datos de 1992 están ausentes. El número de observaciones reales por fecha: 20.
Fuente (nombre):
Indicadores del desarrollo mundial
Fuente (organización):
International Monetary Fund, Government Finance Statistics Yearbook and data files.
Categorías:
Public Sector
Se ha actualizado:
23 abr 2017 año
Los indicadores de los cambios de valor en los últimos años
En promedio:
163.868 bn
Mínimo:
18.0 bn
1 ene 1994 año
Máximo:
459.387 bn
1 ene 2013 año
A la fecha de observación
Valor
Cambio absoluto
El cambio con respecto al valor anterior
1 ene 1993 año
19.5 bn
+19.5 bn
0.0%
1 ene 1994 año
18.0 bn
-1.5 bn
-7.69%
1 ene 1995 año
18.0 bn
0.0
0.0%
1 ene 1996 año
22.4 bn
+4.4 bn
24.44%
1 ene 1997 año
27.3 bn
+4.9 bn
21.88%
1 ene 1998 año
152.3 bn
+125.0 bn
457.88%
1 ene 1999 año
142.7 bn
-9.6 bn
-6.3%
1 ene 2000 año
84.7 bn
-58.0 bn
-40.64%
1 ene 2002 año
94.348 bn
+9.648 bn
11.39%
1 ene 2003 año
159.297 bn
+64.949 bn
68.84%
1 ene 2004 año
119.439 bn
-39.857 bn
-25.02%
1 ene 2005 año
240.415 bn
+120.976 bn
101.29%
1 ene 2006 año
142.747 bn
-97.668 bn
-40.62%
1 ene 2007 año
192.1 bn
+49.353 bn
34.57%
1 ene 2008 año
254.779 bn
+62.679 bn
32.63%
1 ene 2009 año
186.585 bn
-68.194 bn
-26.77%
1 ene 2010 año
284.444 bn
+97.859 bn
52.45%
1 ene 2011 año
312.823 bn
+28.379 bn
9.98%
1 ene 2012 año
346.09 bn
+33.267 bn
10.63%
1 ene 2013 año
459.387 bn
+113.298 bn
32.74%
Ranking de los países por los datos estadísticos actuales