33
/es/
AIzaSyB4mHJ5NPEv-XzF7P6NDYXjlkCWaeKw5bc
November 30, 2025
105369
Chile
CHL
true
2
1
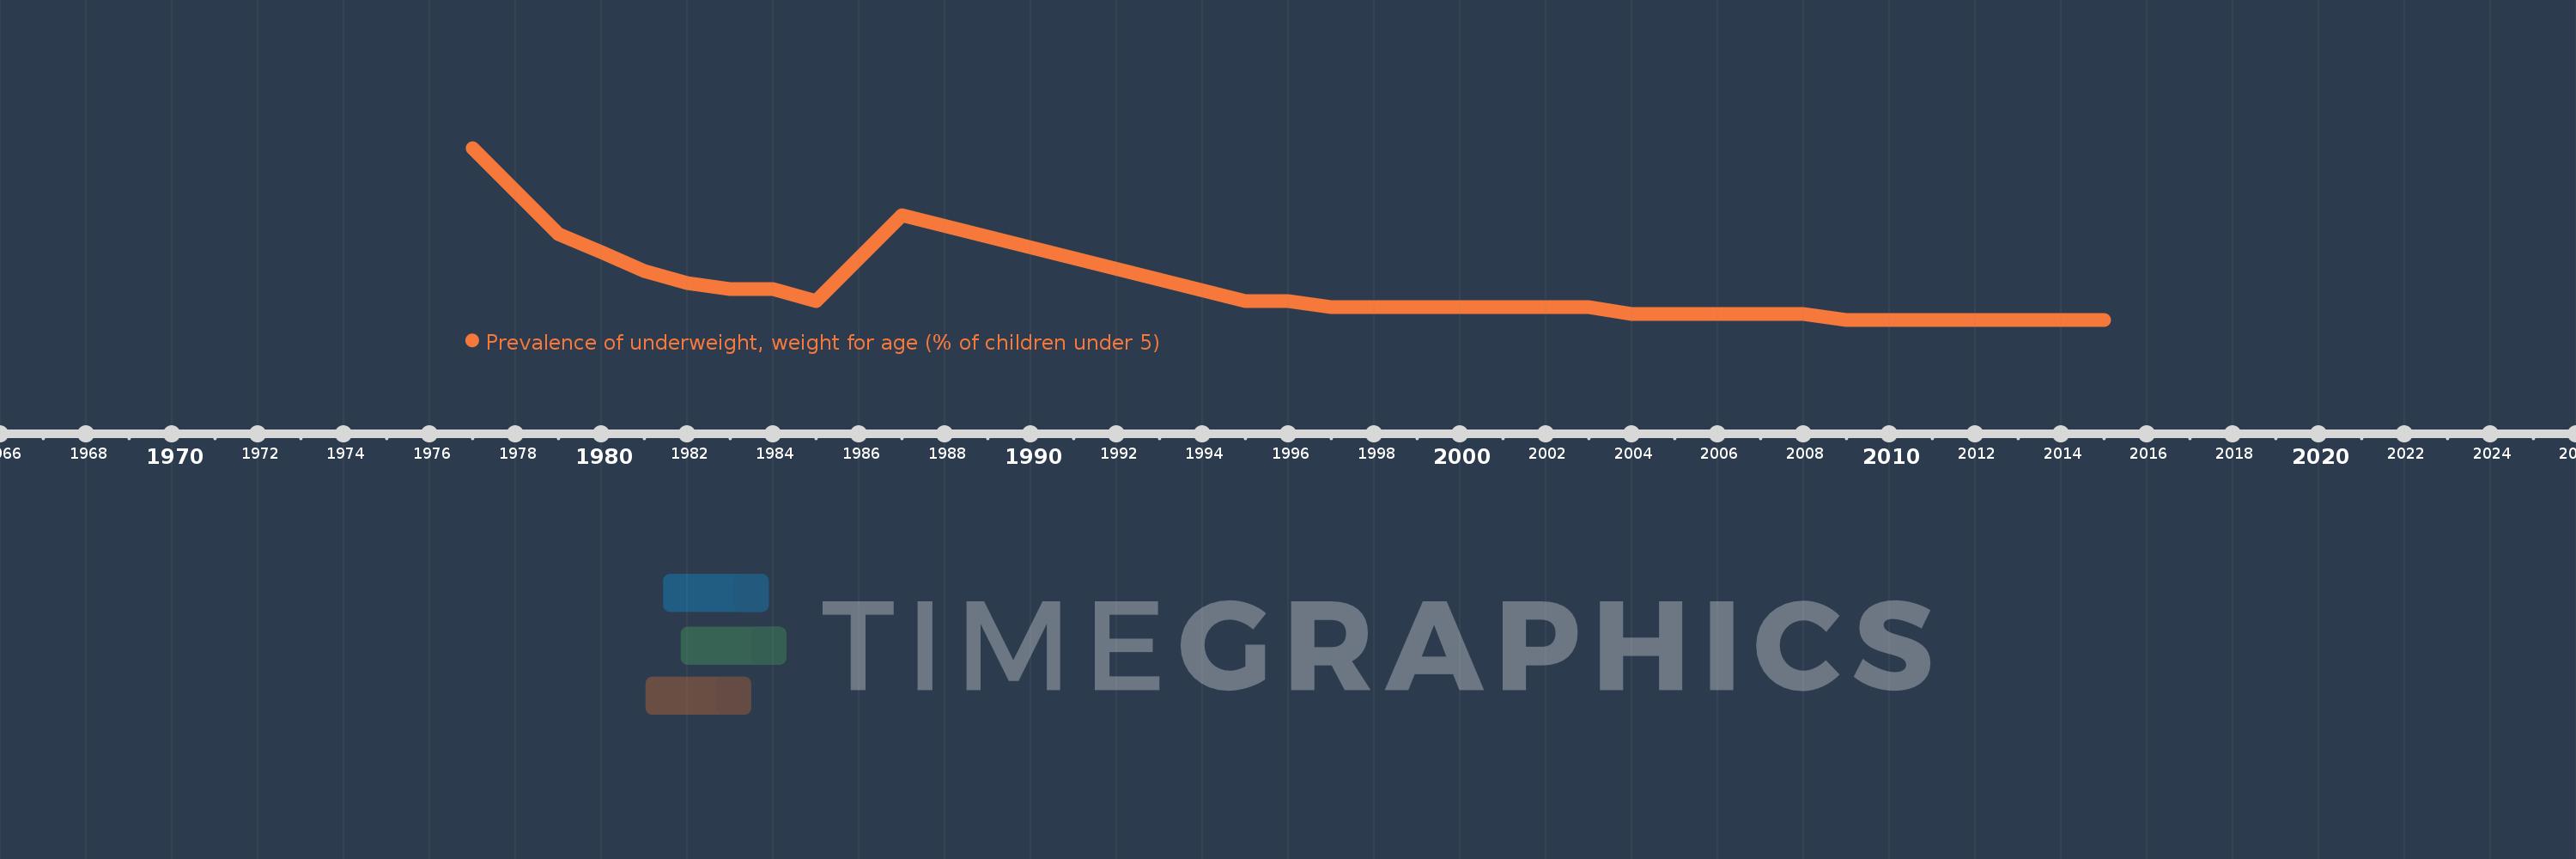
Prevalence of underweight, weight for age (% of children under 5)
2015,2014,2009,2008,2007,2005,2004,2003,2002,2000,1999,1997,1996,1995,1987,1985,1984,1983,1982,1981,1980,1979,1978,1977