33
/es/
AIzaSyB4mHJ5NPEv-XzF7P6NDYXjlkCWaeKw5bc
November 30, 2025
102930
Central African Republic
CAF
true
2
1
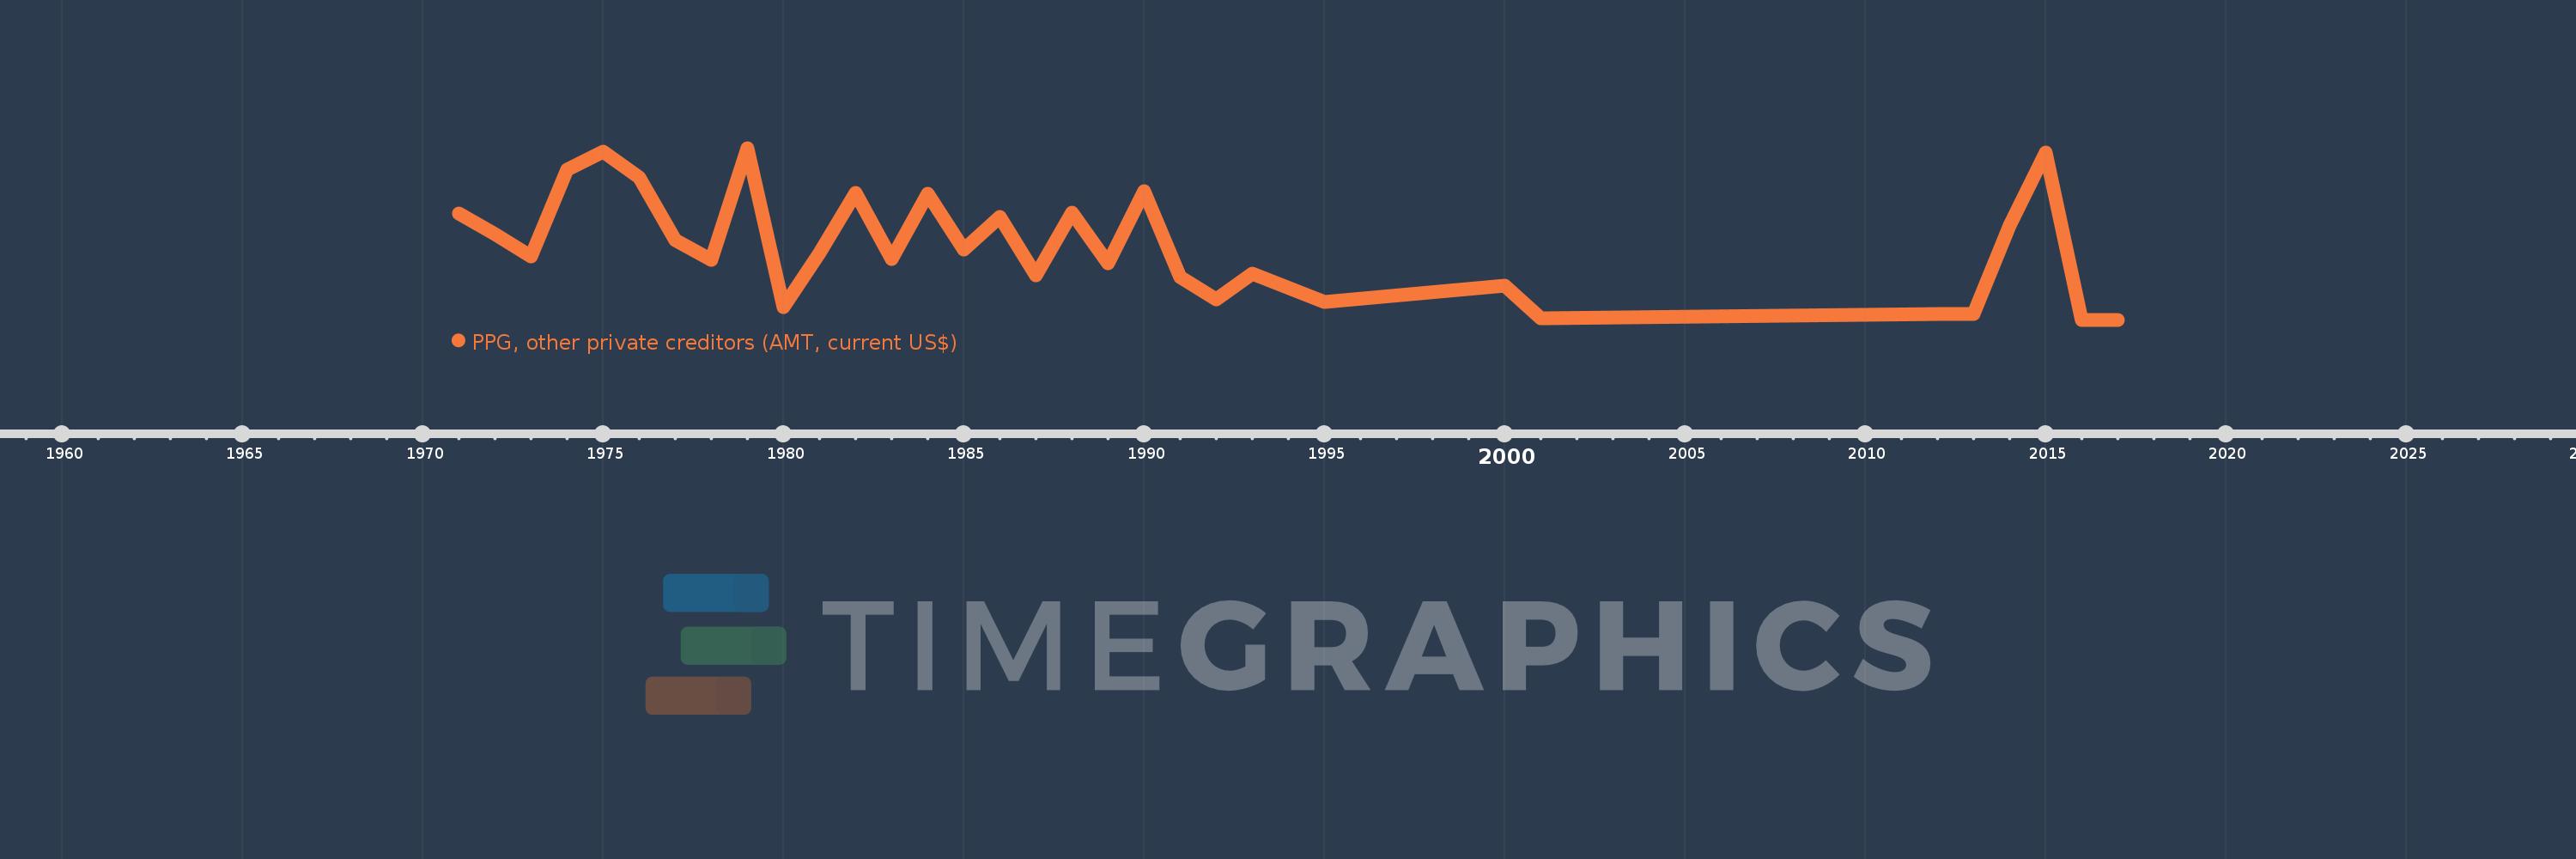
PPG, other private creditors (AMT, current US$)
2017,2016,2015,2014,2013,2012,2001,2000,1995,1993,1992,1991,1990,1989,1988,1987,1986,1985,1984,1983,1982,1981,1980,1979,1978,1977,1976,1975,1974,1973,1972,1971