33
/es/
AIzaSyB4mHJ5NPEv-XzF7P6NDYXjlkCWaeKw5bc
November 1, 2025
102428
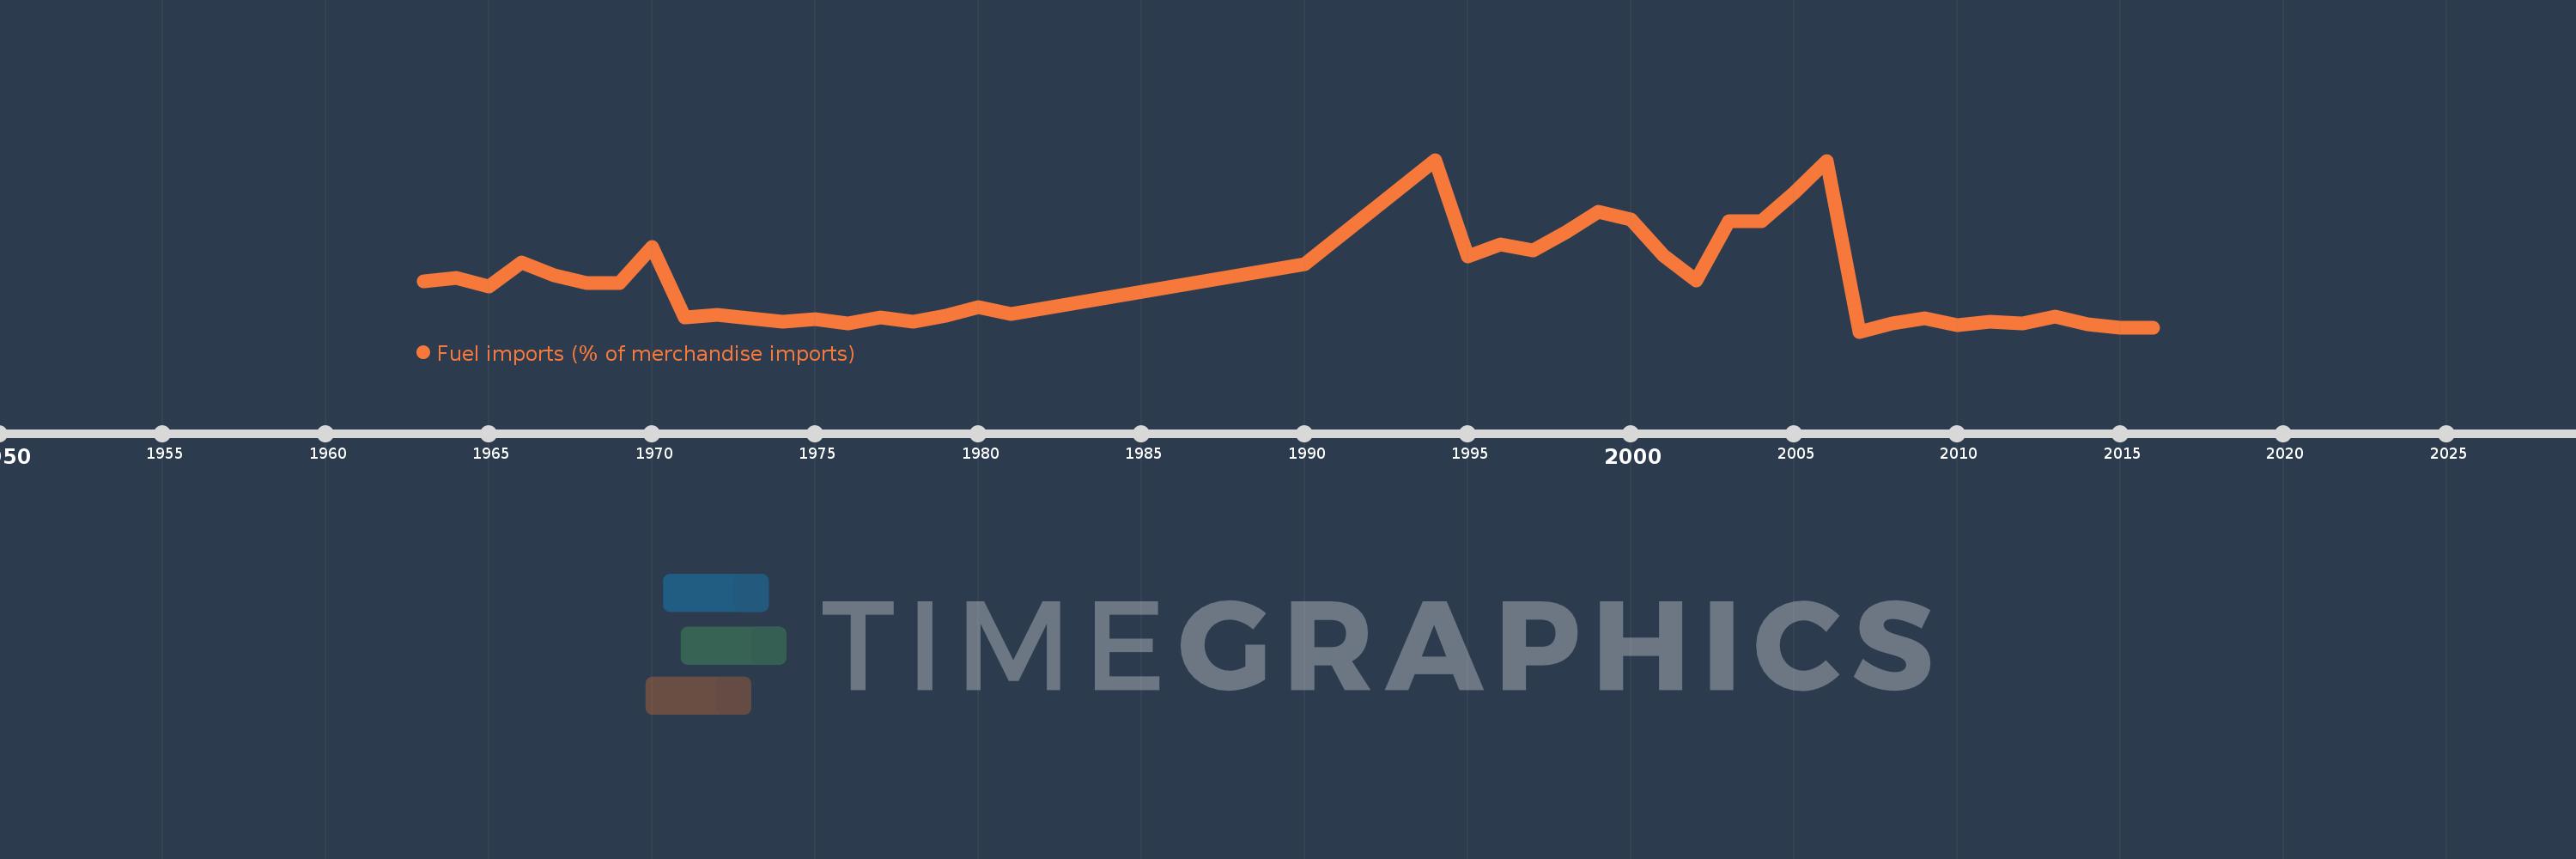
Central African Republic
CAF
true
2
1
Fuel imports (% of merchandise imports)
2016,2015,2014,2013,2012,2011,2010,2009,2008,2007,2006,2005,2004,2003,2002,2001,2000,1999,1998,1997,1996,1995,1994,1990,1981,1980,1979,1978,1977,1976,1975,1974,1972,1971,1970,1969,1968,1967,1966,1965,1964,1963