33
/es/
AIzaSyB4mHJ5NPEv-XzF7P6NDYXjlkCWaeKw5bc
November 1, 2025
102222
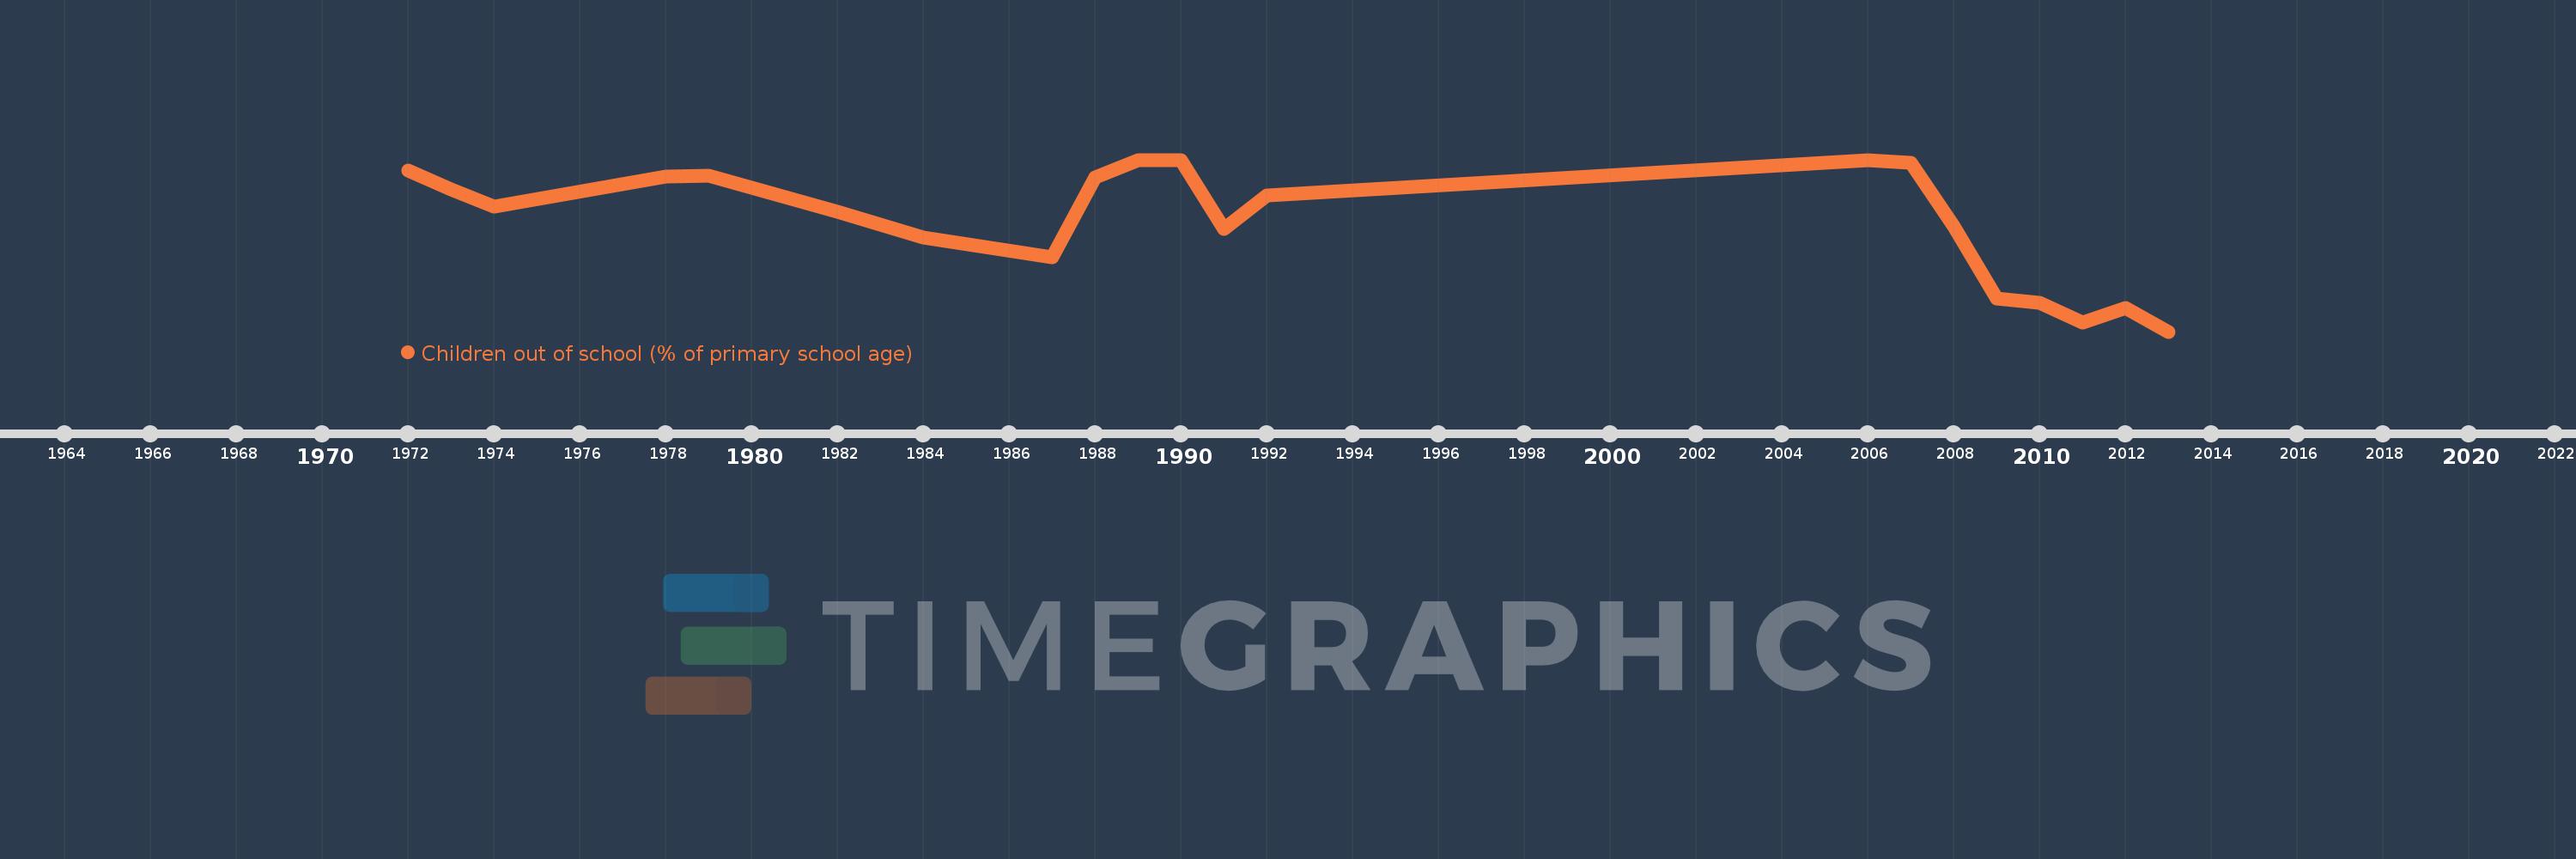
Central African Republic
CAF
true
2
1
Children out of school (% of primary school age)
2013,2012,2011,2010,2009,2008,2007,2006,1992,1991,1990,1989,1988,1987,1984,1983,1982,1979,1978,1974,1973,1972