29
/de/
de
AIzaSyAYiBZKx7MnpbEhh9jyipgxe19OcubqV5w
April 1, 2024
89194
Bosnia and Herzegovina
BIH
true
2
1
Refugee population by country or territory of asylum
2016,2015,2014,2013,2012,2011,2010,2009,2008,2007,2006,2005,2004,2003,2002,2001,2000,1999,1998
Download
Bibliothek der Globalstatistik →Bosnia and Herzegovina →

Refugee population by country or territory of asylum

Diese Statistik in anderen Ländern:
AfghanistanAlbaniaAlgeriaAngolaAntigua and BarbudaArab WorldArgentinaArmeniaArubaAustraliaAustriaAzerbaijanBahamas, TheBahrainBangladeshBarbadosBelarusBelgiumBelizeBeninBoliviaBosnia and HerzegovinaBotswanaBrazilBritish Virgin IslandsBrunei DarussalamBulgariaBurkina FasoBurundiCabo VerdeCambodiaCameroonCanadaCaribbean small statesCayman IslandsCentral African RepublicCentral Europe and the BalticsChadChileChinaColombiaComorosCongo, Dem. Rep.Congo, Rep.Costa RicaCote d'IvoireCroatiaCubaCuracaoCyprusCzech RepublicDenmarkDjiboutiDominicaDominican RepublicEast Asia & PacificEast Asia & Pacific (excluding high income)East Asia & Pacific (IDA & IBRD countries)EcuadorEgypt, Arab Rep.El SalvadorEquatorial GuineaEritreaEstoniaEthiopiaEuro areaEurope & Central AsiaEurope & Central Asia (excluding high income)Europe & Central Asia (IDA & IBRD countries)European UnionFijiFinlandFragile and conflict affected situationsFranceGabonGambia, TheGeorgiaGermanyGhanaGreeceGrenadaGuatemalaGuineaGuinea-BissauGuyanaHaitiHeavily indebted poor countries (HIPC)High incomeHondurasHong Kong SAR, ChinaHungaryIBRD onlyIcelandIDA & IBRD totalIDA blendIDA onlyIDA totalIndiaIndonesiaIran, Islamic Rep.IraqIrelandIsraelItalyJamaicaJapanJordanKazakhstanKenyaKorea, Rep.KuwaitKyrgyz RepublicLao PDRLatin America & Caribbean Latin America & Caribbean (excluding high income)Latin America & the Caribbean (IDA & IBRD countries)LatviaLeast developed countries: UN classificationLebanonLesothoLiberiaLibyaLiechtensteinLithuaniaLow & middle incomeLow incomeLower middle incomeLuxembourgMacao SAR, ChinaMacedonia, FYRMadagascarMalawiMalaysiaMaliMaltaMauritaniaMauritiusMexicoMicronesia, Fed. Sts.Middle East & North AfricaMiddle East & North Africa (excluding high income)Middle East & North Africa (IDA & IBRD countries)Middle incomeMoldovaMonacoMongoliaMontenegroMoroccoMozambiqueMyanmarNamibiaNauruNepalNetherlandsNew ZealandNicaraguaNigerNigeriaNorth AmericaNorwayOECD membersOmanOther small statesPacific island small statesPakistanPalauPanamaPapua New GuineaParaguayPeruPhilippinesPolandPortugalQatarRomaniaRussian FederationRwandaSamoaSao Tome and PrincipeSaudi ArabiaSenegalSerbiaSierra LeoneSingaporeSint Maarten (Dutch part)Slovak RepublicSloveniaSmall statesSolomon IslandsSomaliaSouth AfricaSouth AsiaSouth Asia (IDA & IBRD)South SudanSpainSri LankaSt. Kitts and NevisSt. LuciaSt. Vincent and the GrenadinesSub-Saharan Africa Sub-Saharan Africa (excluding high income)Sub-Saharan Africa (IDA & IBRD countries)SudanSurinameSwazilandSwedenSwitzerlandSyrian Arab RepublicTajikistanTanzaniaThailandTimor-LesteTogoTongaTrinidad and TobagoTunisiaTurkeyTurkmenistanTurks and Caicos IslandsUgandaUkraineUnited Arab EmiratesUnited KingdomUnited StatesUpper middle incomeUruguayUzbekistanVanuatuVenezuela, RBVietnamWest Bank and GazaWorldYemen, Rep.ZambiaZimbabwe
Zeitlinie:
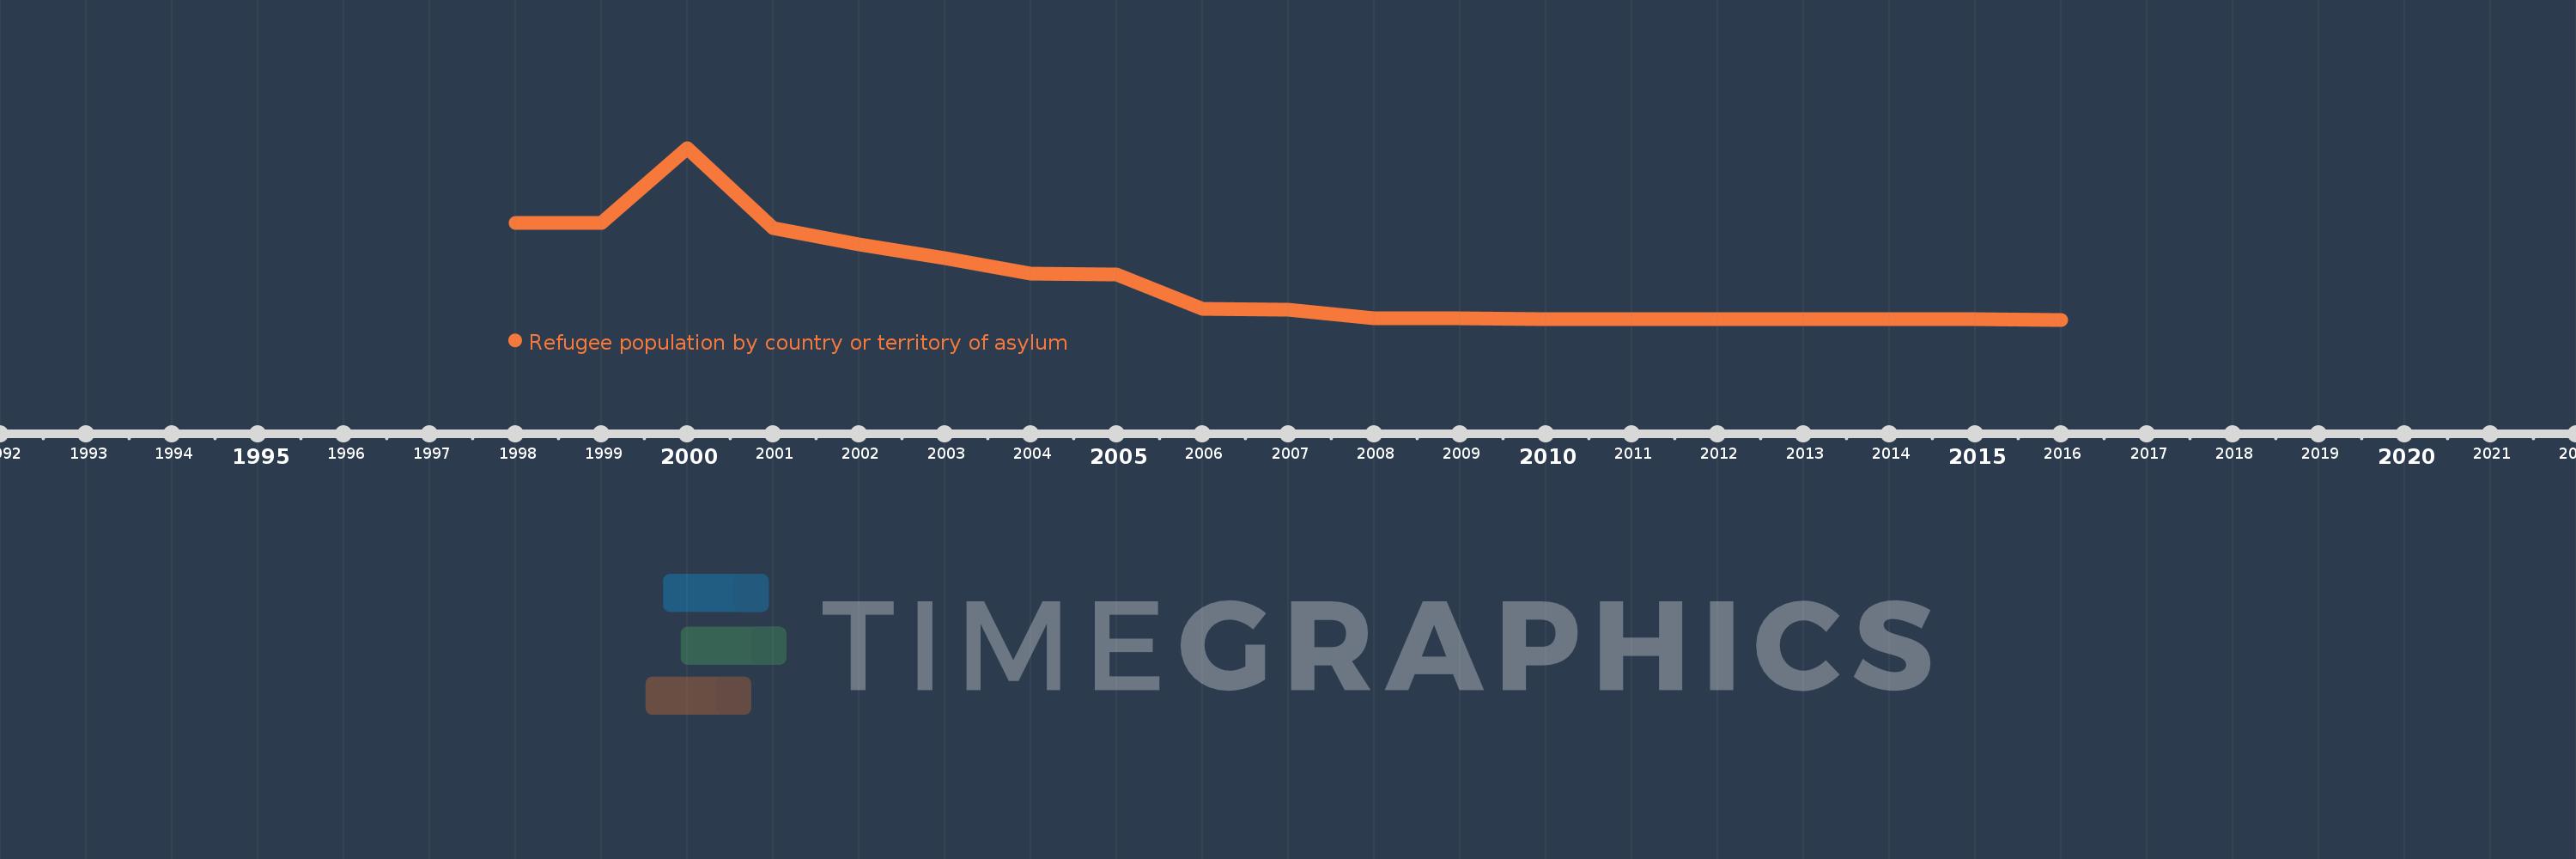
Diese Zeitleiste vorliegt die Graphik ab 1998 J. bis 2016 J. Bosnia and Herzegovina. Die Angaben bis 1997 J. sind nicht vorhanden. Die Zahl aktueller Beobachtungen nach Daten: 19.
Die Quelle (Bezeichnung):
Kennzahlen der Weltentwicklung
Die Quelle (Einrichtung):
United Nations High Commissioner for Refugees (UNHCR), Statistical Yearbook and data files, complemented by statistics on Palestinian refugees under the mandate of the UNRWA as published on its website. Data from UNHCR are available online at: www.unhcr.org/statistics/populationdatabase.
Kategorien:
Health, Social Development
Es wurde aktualisiert:
23 Apr 2017 Jahr
Kennzahlen der Wertänderungen vom Jahr zum Jahr
im Durchschnitt:
19.653 Tsnd.
Minimum:
6.798 Tsnd.
1 Jan 2016 Jahr
Maximum:
65.645 Tsnd.
1 Jan 2000 Jahr
Zum Datum der Beobachtung
Wert
Absolute Veränderung
Die Veränderung bezüglich dem vorherigen Wert
1 Jan 1998 Jahr
40.0 Tsnd.
+40.0 Tsnd.
0.0%
1 Jan 1999 Jahr
40.0 Tsnd.
0.0
0.0%
1 Jan 2000 Jahr
65.645 Tsnd.
+25.645 Tsnd.
64.11%
1 Jan 2001 Jahr
38.152 Tsnd.
-27.493 Tsnd.
-41.88%
1 Jan 2002 Jahr
32.745 Tsnd.
-5.407 Tsnd.
-14.17%
1 Jan 2003 Jahr
28.022 Tsnd.
-4.723 Tsnd.
-14.42%
1 Jan 2004 Jahr
22.517 Tsnd.
-5.505 Tsnd.
-19.65%
1 Jan 2005 Jahr
22.215 Tsnd.
-302.0
-1.34%
1 Jan 2006 Jahr
10.568 Tsnd.
-11.647 Tsnd.
-52.43%
1 Jan 2007 Jahr
10.318 Tsnd.
-250.0
-2.37%
1 Jan 2008 Jahr
7.367 Tsnd.
-2.951 Tsnd.
-28.6%
1 Jan 2009 Jahr
7.257 Tsnd.
-110.0
-1.49%
1 Jan 2010 Jahr
7.132 Tsnd.
-125.0
-1.72%
1 Jan 2011 Jahr
7.016 Tsnd.
-116.0
-1.63%
1 Jan 2012 Jahr
6.933 Tsnd.
-83.0
-1.18%
1 Jan 2013 Jahr
6.903 Tsnd.
-30.0
-0.43%
1 Jan 2014 Jahr
6.926 Tsnd.
+23.0
0.33%
1 Jan 2015 Jahr
6.89 Tsnd.
-36.0
-0.52%
1 Jan 2016 Jahr
6.798 Tsnd.
-92.0
-1.34%
Bewertung der Länder gemäß mit laufender Statistik nach Jahren

Kommentare:

Abschicken
PremiumAbout & FeedbackVereinbarungPrivatheit
logo
© 2022 Selected Technologies LLC – Morgan Hill, California