33
/de/
AIzaSyAYiBZKx7MnpbEhh9jyipgxe19OcubqV5w
August 1, 2025
128830
Eritrea
ERI
true
2
1
Refugee population by country or territory of asylum
2016,2015,2014,2013,2012,2011,2010,2009,2008,2007,2006,2005,2004,2003,2002,2001,2000,1999,1998,1997,1996,1995,1994
Download
Bibliothek der Globalstatistik →Eritrea →

Refugee population by country or territory of asylum

Diese Statistik in anderen Ländern:

AfghanistanAlbaniaAlgeriaAngolaAntigua and BarbudaArab WorldArgentinaArmeniaArubaAustraliaAustriaAzerbaijanBahamas, TheBahrainBangladeshBarbadosBelarusBelgiumBelizeBeninBoliviaBosnia and HerzegovinaBotswanaBrazilBritish Virgin IslandsBrunei DarussalamBulgariaBurkina FasoBurundiCabo VerdeCambodiaCameroonCanadaCaribbean small statesCayman IslandsCentral African RepublicCentral Europe and the BalticsChadChileChinaColombiaComorosCongo, Dem. Rep.Congo, Rep.Costa RicaCote d'IvoireCroatiaCubaCuracaoCyprusCzech RepublicDenmarkDjiboutiDominicaDominican RepublicEast Asia & PacificEast Asia & Pacific (excluding high income)East Asia & Pacific (IDA & IBRD countries)EcuadorEgypt, Arab Rep.El SalvadorEquatorial GuineaEritreaEstoniaEthiopiaEuro areaEurope & Central AsiaEurope & Central Asia (excluding high income)Europe & Central Asia (IDA & IBRD countries)European UnionFijiFinlandFragile and conflict affected situationsFranceGabonGambia, TheGeorgiaGermanyGhanaGreeceGrenadaGuatemalaGuineaGuinea-BissauGuyanaHaitiHeavily indebted poor countries (HIPC)High incomeHondurasHong Kong SAR, ChinaHungaryIBRD onlyIcelandIDA & IBRD totalIDA blendIDA onlyIDA totalIndiaIndonesiaIran, Islamic Rep.IraqIrelandIsraelItalyJamaicaJapanJordanKazakhstanKenyaKorea, Rep.KuwaitKyrgyz RepublicLao PDRLatin America & Caribbean Latin America & Caribbean (excluding high income)Latin America & the Caribbean (IDA & IBRD countries)LatviaLeast developed countries: UN classificationLebanonLesothoLiberiaLibyaLiechtensteinLithuaniaLow & middle incomeLow incomeLower middle incomeLuxembourgMacao SAR, ChinaMacedonia, FYRMadagascarMalawiMalaysiaMaliMaltaMauritaniaMauritiusMexicoMicronesia, Fed. Sts.Middle East & North AfricaMiddle East & North Africa (excluding high income)Middle East & North Africa (IDA & IBRD countries)Middle incomeMoldovaMonacoMongoliaMontenegroMoroccoMozambiqueMyanmarNamibiaNauruNepalNetherlandsNew ZealandNicaraguaNigerNigeriaNorth AmericaNorwayOECD membersOmanOther small statesPacific island small statesPakistanPalauPanamaPapua New GuineaParaguayPeruPhilippinesPolandPortugalQatarRomaniaRussian FederationRwandaSamoaSao Tome and PrincipeSaudi ArabiaSenegalSerbiaSierra LeoneSingaporeSint Maarten (Dutch part)Slovak RepublicSloveniaSmall statesSolomon IslandsSomaliaSouth AfricaSouth AsiaSouth Asia (IDA & IBRD)South SudanSpainSri LankaSt. Kitts and NevisSt. LuciaSt. Vincent and the GrenadinesSub-Saharan Africa Sub-Saharan Africa (excluding high income)Sub-Saharan Africa (IDA & IBRD countries)SudanSurinameSwazilandSwedenSwitzerlandSyrian Arab RepublicTajikistanTanzaniaThailandTimor-LesteTogoTongaTrinidad and TobagoTunisiaTurkeyTurkmenistanTurks and Caicos IslandsUgandaUkraineUnited Arab EmiratesUnited KingdomUnited StatesUpper middle incomeUruguayUzbekistanVanuatuVenezuela, RBVietnamWest Bank and GazaWorldYemen, Rep.ZambiaZimbabwe

Zeitlinie:

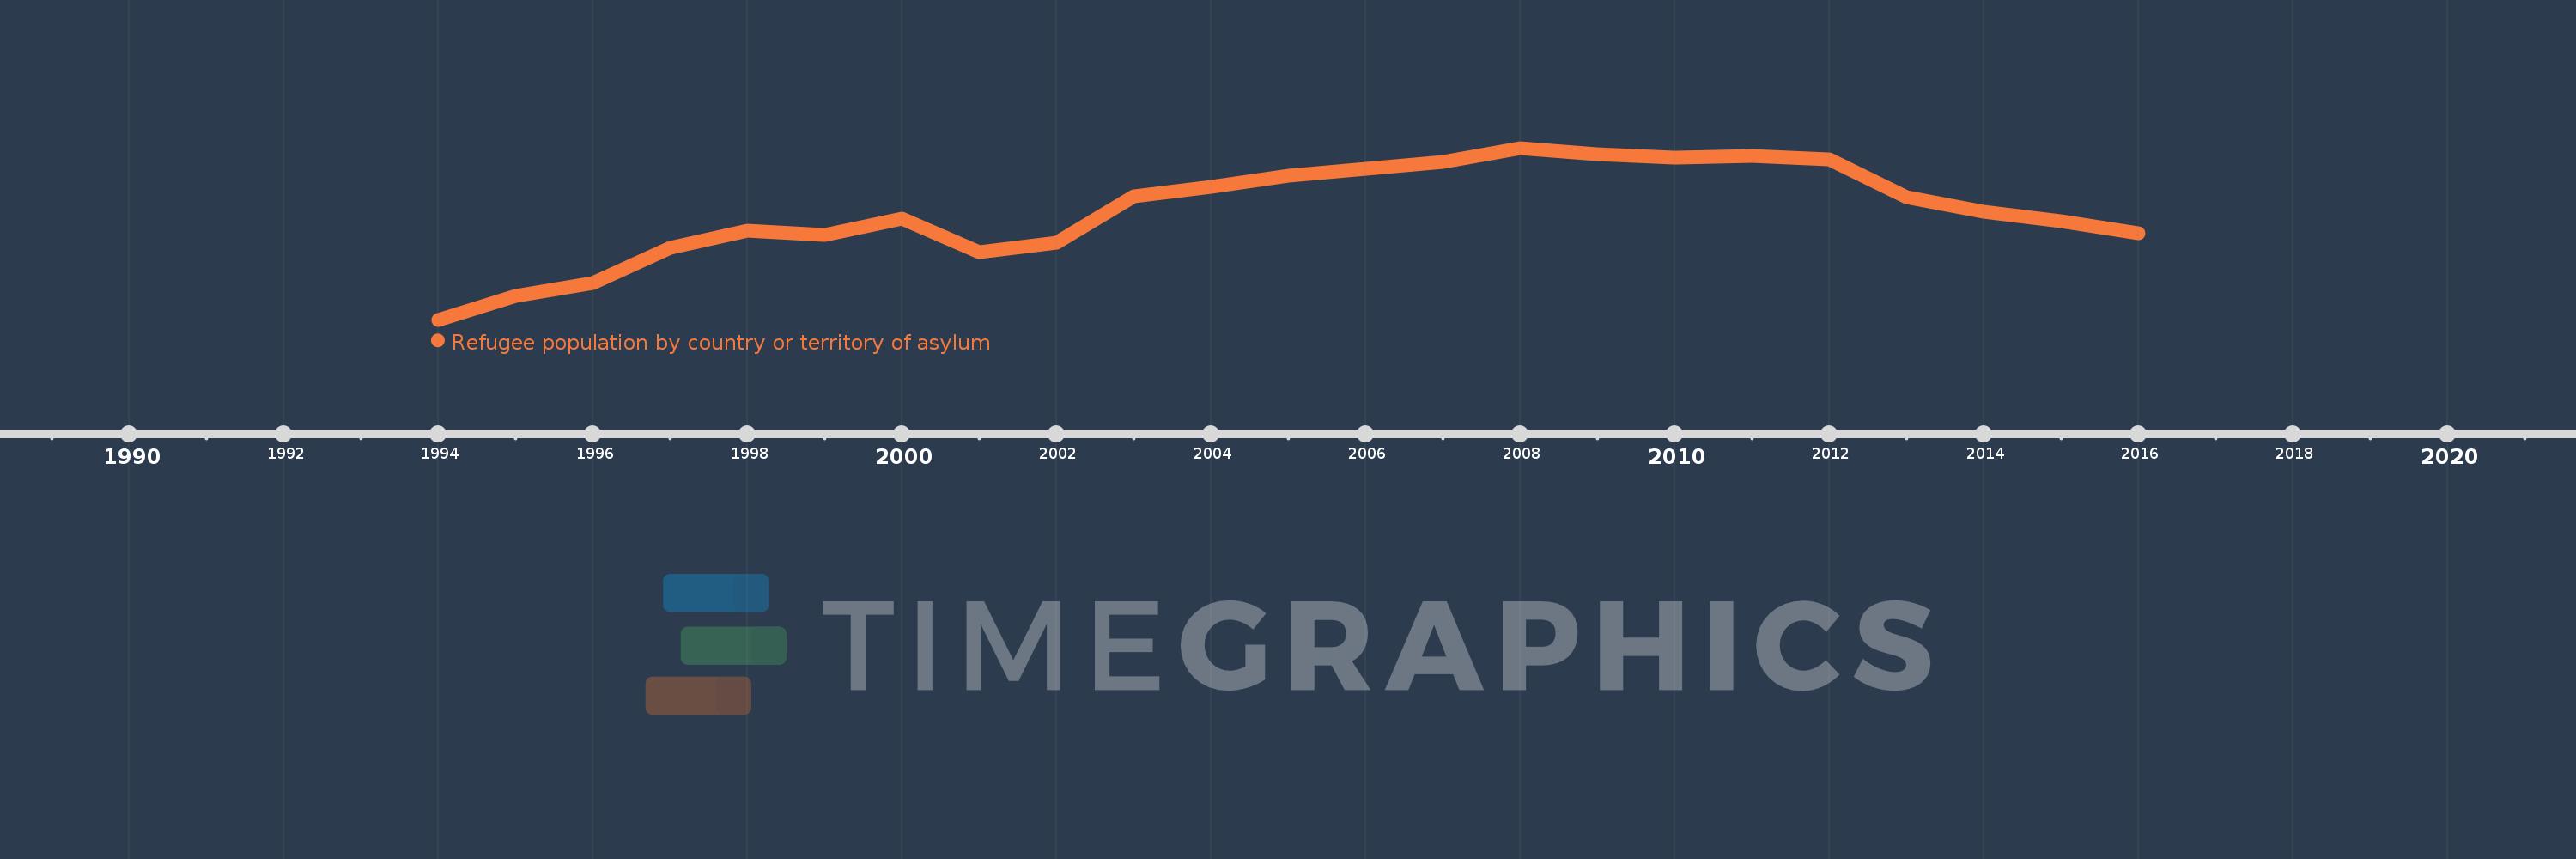
Diese Zeitleiste vorliegt die Graphik ab 1994 J. bis 2016 J. Eritrea. Die Angaben bis 1993 J. sind nicht vorhanden. Die Zahl aktueller Beobachtungen nach Daten: 23.

Die Quelle (Bezeichnung):

Kennzahlen der Weltentwicklung

Die Quelle (Einrichtung):

United Nations High Commissioner for Refugees (UNHCR), Statistical Yearbook and data files, complemented by statistics on Palestinian refugees under the mandate of the UNRWA as published on its website. Data from UNHCR are available online at: www.unhcr.org/statistics/populationdatabase.

Kategorien:

Health, Social Development

Es wurde aktualisiert:

23 Apr 2017 Jahr

Kennzahlen der Wertänderungen vom Jahr zum Jahr

im Durchschnitt:
3.192 Tsnd.
Minimum:
3.0
1 Jan 1994 Jahr
Maximum:
5.042 Tsnd.
1 Jan 2008 Jahr
Zum Datum der Beobachtung
Wert
Absolute Veränderung
Die Veränderung bezüglich dem vorherigen Wert
1 Jan 1994 Jahr
3.0
+3.0
0.0%
1 Jan 1995 Jahr
706.0
+703.0
23.43 Tsnd.%
1 Jan 1996 Jahr
1.083 Tsnd.
+377.0
53.4%
1 Jan 1997 Jahr
2.106 Tsnd.
+1.023 Tsnd.
94.46%
1 Jan 1998 Jahr
2.606 Tsnd.
+500.0
23.74%
1 Jan 1999 Jahr
2.501 Tsnd.
-105.0
-4.03%
1 Jan 2000 Jahr
2.972 Tsnd.
+471.0
18.83%
1 Jan 2001 Jahr
1.984 Tsnd.
-988.0
-33.24%
1 Jan 2002 Jahr
2.272 Tsnd.
+288.0
14.52%
1 Jan 2003 Jahr
3.619 Tsnd.
+1.347 Tsnd.
59.29%
1 Jan 2004 Jahr
3.889 Tsnd.
+270.0
7.46%
1 Jan 2005 Jahr
4.24 Tsnd.
+351.0
9.03%
1 Jan 2006 Jahr
4.418 Tsnd.
+178.0
4.2%
1 Jan 2007 Jahr
4.621 Tsnd.
+203.0
4.59%
1 Jan 2008 Jahr
5.042 Tsnd.
+421.0
9.11%
1 Jan 2009 Jahr
4.862 Tsnd.
-180.0
-3.57%
1 Jan 2010 Jahr
4.751 Tsnd.
-111.0
-2.28%
1 Jan 2011 Jahr
4.809 Tsnd.
+58.0
1.22%
1 Jan 2012 Jahr
4.719 Tsnd.
-90.0
-1.87%
1 Jan 2013 Jahr
3.6 Tsnd.
-1.119 Tsnd.
-23.71%
1 Jan 2014 Jahr
3.166 Tsnd.
-434.0
-12.06%
1 Jan 2015 Jahr
2.898 Tsnd.
-268.0
-8.46%
1 Jan 2016 Jahr
2.549 Tsnd.
-349.0
-12.04%

Bewertung der Länder gemäß mit laufender Statistik nach Jahren