33
/de/
AIzaSyAYiBZKx7MnpbEhh9jyipgxe19OcubqV5w
August 1, 2025
88167
Bosnia and Herzegovina
BIH
true
2
1
Adjusted savings: net national savings (% of GNI)
2015,2014,2013,2012,2011,2010,2009,2008,2007,2006,2005,2004,2003,2002,2001,2000,1999
Download
Bibliothek der Globalstatistik →Bosnia and Herzegovina →

Adjusted savings: net national savings (% of GNI)

Diese Statistik in anderen Ländern:

AfghanistanAlbaniaAlgeriaAngolaAntigua and BarbudaArab WorldArgentinaArmeniaAustraliaAustriaAzerbaijanBahamas, TheBahrainBangladeshBarbadosBelarusBelgiumBelizeBeninBermudaBhutanBoliviaBosnia and HerzegovinaBotswanaBrazilBrunei DarussalamBulgariaBurkina FasoBurundiCabo VerdeCambodiaCameroonCanadaCaribbean small statesCentral African RepublicCentral Europe and the BalticsChadChileChinaColombiaComorosCongo, Dem. Rep.Congo, Rep.Costa RicaCote d'IvoireCroatiaCyprusCzech RepublicDenmarkDjiboutiDominicaDominican RepublicEarly-demographic dividendEast Asia & PacificEast Asia & Pacific (excluding high income)East Asia & Pacific (IDA & IBRD countries)EcuadorEgypt, Arab Rep.El SalvadorEquatorial GuineaEritreaEstoniaEthiopiaEuro areaEurope & Central AsiaEurope & Central Asia (excluding high income)Europe & Central Asia (IDA & IBRD countries)European UnionFijiFinlandFragile and conflict affected situationsFranceGabonGambia, TheGeorgiaGermanyGhanaGreeceGrenadaGuatemalaGuineaGuinea-BissauGuyanaHaitiHeavily indebted poor countries (HIPC)High incomeHondurasHong Kong SAR, ChinaHungaryIBRD onlyIcelandIDA & IBRD totalIDA blendIDA onlyIDA totalIndiaIndonesiaIran, Islamic Rep.IraqIrelandIsraelItalyJamaicaJapanJordanKazakhstanKenyaKiribatiKorea, Rep.KosovoKuwaitKyrgyz RepublicLao PDRLate-demographic dividendLatin America & Caribbean Latin America & Caribbean (excluding high income)Latin America & the Caribbean (IDA & IBRD countries)LatviaLeast developed countries: UN classificationLebanonLesothoLiberiaLibyaLithuaniaLow & middle incomeLow incomeLower middle incomeLuxembourgMacao SAR, ChinaMacedonia, FYRMadagascarMalawiMalaysiaMaldivesMaliMaltaMauritaniaMauritiusMexicoMiddle East & North AfricaMiddle East & North Africa (excluding high income)Middle East & North Africa (IDA & IBRD countries)Middle incomeMoldovaMongoliaMontenegroMoroccoMozambiqueNamibiaNepalNetherlandsNew ZealandNicaraguaNigerNigeriaNorth AmericaNorwayOECD membersOmanOther small statesPacific island small statesPakistanPanamaPapua New GuineaParaguayPeruPhilippinesPolandPortugalPost-demographic dividendPre-demographic dividendQatarRomaniaRussian FederationRwandaSaudi ArabiaSenegalSerbiaSeychellesSierra LeoneSingaporeSlovak RepublicSloveniaSmall statesSolomon IslandsSouth AfricaSouth AsiaSouth Asia (IDA & IBRD)SpainSri LankaSt. Kitts and NevisSt. LuciaSt. Vincent and the GrenadinesSub-Saharan Africa Sub-Saharan Africa (excluding high income)Sub-Saharan Africa (IDA & IBRD countries)SudanSurinameSwazilandSwedenSwitzerlandSyrian Arab RepublicTajikistanTanzaniaThailandTimor-LesteTogoTongaTrinidad and TobagoTunisiaTurkeyTurkmenistanUgandaUkraineUnited KingdomUnited StatesUpper middle incomeUruguayVanuatuVenezuela, RBVietnamWest Bank and GazaWorldYemen, Rep.ZambiaZimbabwe

Zeitlinie:

Diese Zeitleiste vorliegt die Graphik ab 1999 J. bis 2015 J. Bosnia and Herzegovina. Die Angaben bis 1998 J. sind nicht vorhanden. Die Zahl aktueller Beobachtungen nach Daten: 17.

Die Quelle (Bezeichnung):

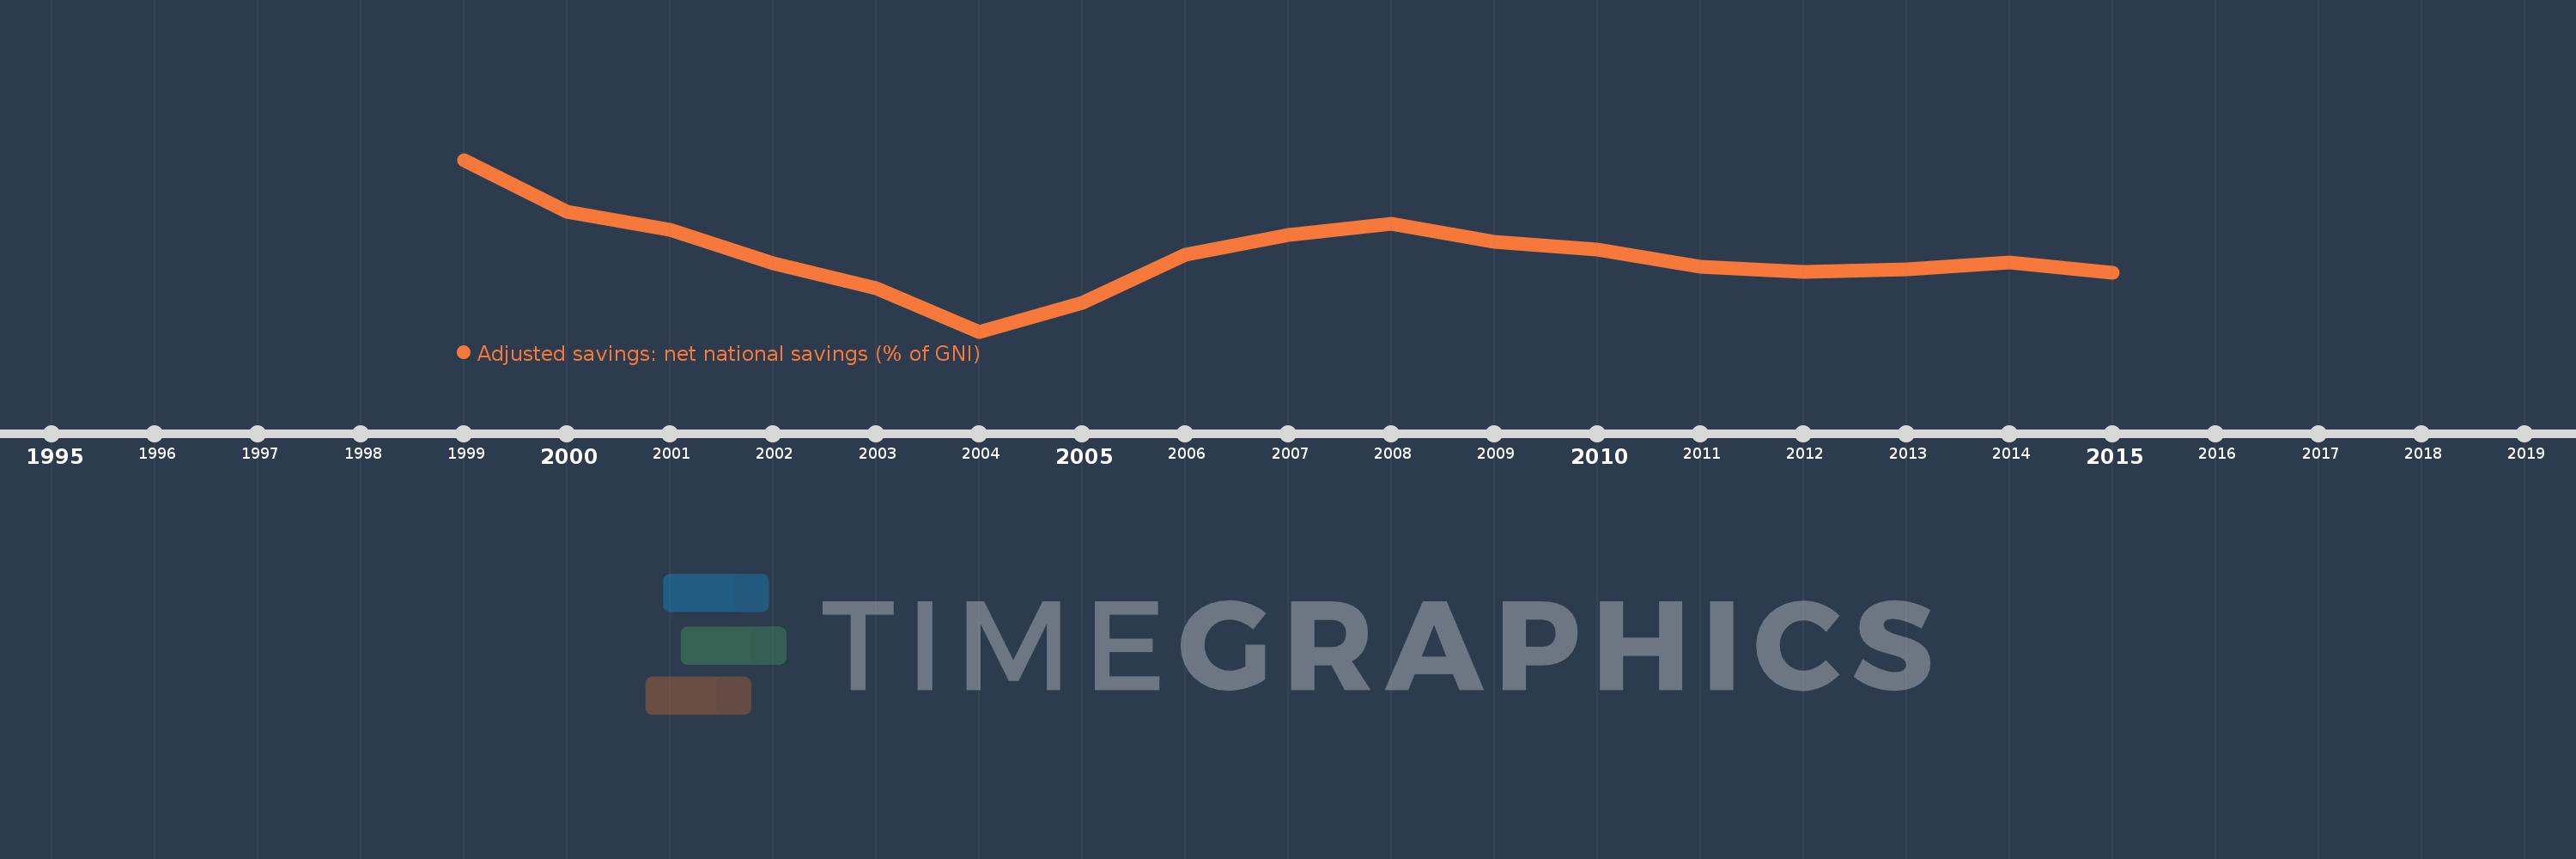
Kennzahlen der Weltentwicklung

Die Quelle (Einrichtung):

World Bank staff estimates based on sources and methods in World Bank's "The Changing Wealth of Nations: Measuring Sustainable Development in the New Millennium" (2011).

Kategorien:

Economy & Growth, Environment

Es wurde aktualisiert:

23 Apr 2017 Jahr

Kennzahlen der Wertänderungen vom Jahr zum Jahr

im Durchschnitt:
1.264
Minimum:
-14.482
1 Jan 2004 Jahr
Maximum:
20.869
1 Jan 1999 Jahr
Zum Datum der Beobachtung
Wert
Absolute Veränderung
Die Veränderung bezüglich dem vorherigen Wert
1 Jan 1999 Jahr
20.869
+20.869
0.0%
1 Jan 2000 Jahr
10.15
-10.719
-51.36%
1 Jan 2001 Jahr
6.481
-3.668
-36.14%
1 Jan 2002 Jahr
-0.469
-6.95
-107.24%
1 Jan 2003 Jahr
-5.474
-5.005
1.07 Tsnd.%
1 Jan 2004 Jahr
-14.482
-9.008
164.55%
1 Jan 2005 Jahr
-8.519
+5.963
-41.18%
1 Jan 2006 Jahr
1.337
+9.856
-115.69%
1 Jan 2007 Jahr
5.382
+4.045
302.6%
1 Jan 2008 Jahr
7.674
+2.292
42.58%
1 Jan 2009 Jahr
3.926
-3.748
-48.85%
1 Jan 2010 Jahr
2.343
-1.582
-40.3%
1 Jan 2011 Jahr
-1.127
-3.471
-148.1%
1 Jan 2012 Jahr
-2.205
-1.078
95.61%
1 Jan 2013 Jahr
-1.732
+0.473
-21.44%
1 Jan 2014 Jahr
-0.285
+1.447
-83.55%
1 Jan 2015 Jahr
-2.382
-2.097
735.88%

Bewertung der Länder gemäß mit laufender Statistik nach Jahren