30
/de/
AIzaSyAYiBZKx7MnpbEhh9jyipgxe19OcubqV5w
April 1, 2024
188684
Maldives
MDV
true
2
1
Adjusted savings: net national savings (% of GNI)
2006,2005,2004,2003,2002,2001,2000,1999,1998,1997,1996
Download
Bibliothek der Globalstatistik →Maldives →

Adjusted savings: net national savings (% of GNI)

Diese Statistik in anderen Ländern:

AfghanistanAlbaniaAlgeriaAngolaAntigua and BarbudaArab WorldArgentinaArmeniaAustraliaAustriaAzerbaijanBahamas, TheBahrainBangladeshBarbadosBelarusBelgiumBelizeBeninBermudaBhutanBoliviaBosnia and HerzegovinaBotswanaBrazilBrunei DarussalamBulgariaBurkina FasoBurundiCabo VerdeCambodiaCameroonCanadaCaribbean small statesCentral African RepublicCentral Europe and the BalticsChadChileChinaColombiaComorosCongo, Dem. Rep.Congo, Rep.Costa RicaCote d'IvoireCroatiaCyprusCzech RepublicDenmarkDjiboutiDominicaDominican RepublicEarly-demographic dividendEast Asia & PacificEast Asia & Pacific (excluding high income)East Asia & Pacific (IDA & IBRD countries)EcuadorEgypt, Arab Rep.El SalvadorEquatorial GuineaEritreaEstoniaEthiopiaEuro areaEurope & Central AsiaEurope & Central Asia (excluding high income)Europe & Central Asia (IDA & IBRD countries)European UnionFijiFinlandFragile and conflict affected situationsFranceGabonGambia, TheGeorgiaGermanyGhanaGreeceGrenadaGuatemalaGuineaGuinea-BissauGuyanaHaitiHeavily indebted poor countries (HIPC)High incomeHondurasHong Kong SAR, ChinaHungaryIBRD onlyIcelandIDA & IBRD totalIDA blendIDA onlyIDA totalIndiaIndonesiaIran, Islamic Rep.IraqIrelandIsraelItalyJamaicaJapanJordanKazakhstanKenyaKiribatiKorea, Rep.KosovoKuwaitKyrgyz RepublicLao PDRLate-demographic dividendLatin America & Caribbean Latin America & Caribbean (excluding high income)Latin America & the Caribbean (IDA & IBRD countries)LatviaLeast developed countries: UN classificationLebanonLesothoLiberiaLibyaLithuaniaLow & middle incomeLow incomeLower middle incomeLuxembourgMacao SAR, ChinaMacedonia, FYRMadagascarMalawiMalaysiaMaldivesMaliMaltaMauritaniaMauritiusMexicoMiddle East & North AfricaMiddle East & North Africa (excluding high income)Middle East & North Africa (IDA & IBRD countries)Middle incomeMoldovaMongoliaMontenegroMoroccoMozambiqueNamibiaNepalNetherlandsNew ZealandNicaraguaNigerNigeriaNorth AmericaNorwayOECD membersOmanOther small statesPacific island small statesPakistanPanamaPapua New GuineaParaguayPeruPhilippinesPolandPortugalPost-demographic dividendPre-demographic dividendQatarRomaniaRussian FederationRwandaSaudi ArabiaSenegalSerbiaSeychellesSierra LeoneSingaporeSlovak RepublicSloveniaSmall statesSolomon IslandsSouth AfricaSouth AsiaSouth Asia (IDA & IBRD)SpainSri LankaSt. Kitts and NevisSt. LuciaSt. Vincent and the GrenadinesSub-Saharan Africa Sub-Saharan Africa (excluding high income)Sub-Saharan Africa (IDA & IBRD countries)SudanSurinameSwazilandSwedenSwitzerlandSyrian Arab RepublicTajikistanTanzaniaThailandTimor-LesteTogoTongaTrinidad and TobagoTunisiaTurkeyTurkmenistanUgandaUkraineUnited KingdomUnited StatesUpper middle incomeUruguayVanuatuVenezuela, RBVietnamWest Bank and GazaWorldYemen, Rep.ZambiaZimbabwe

Zeitlinie:

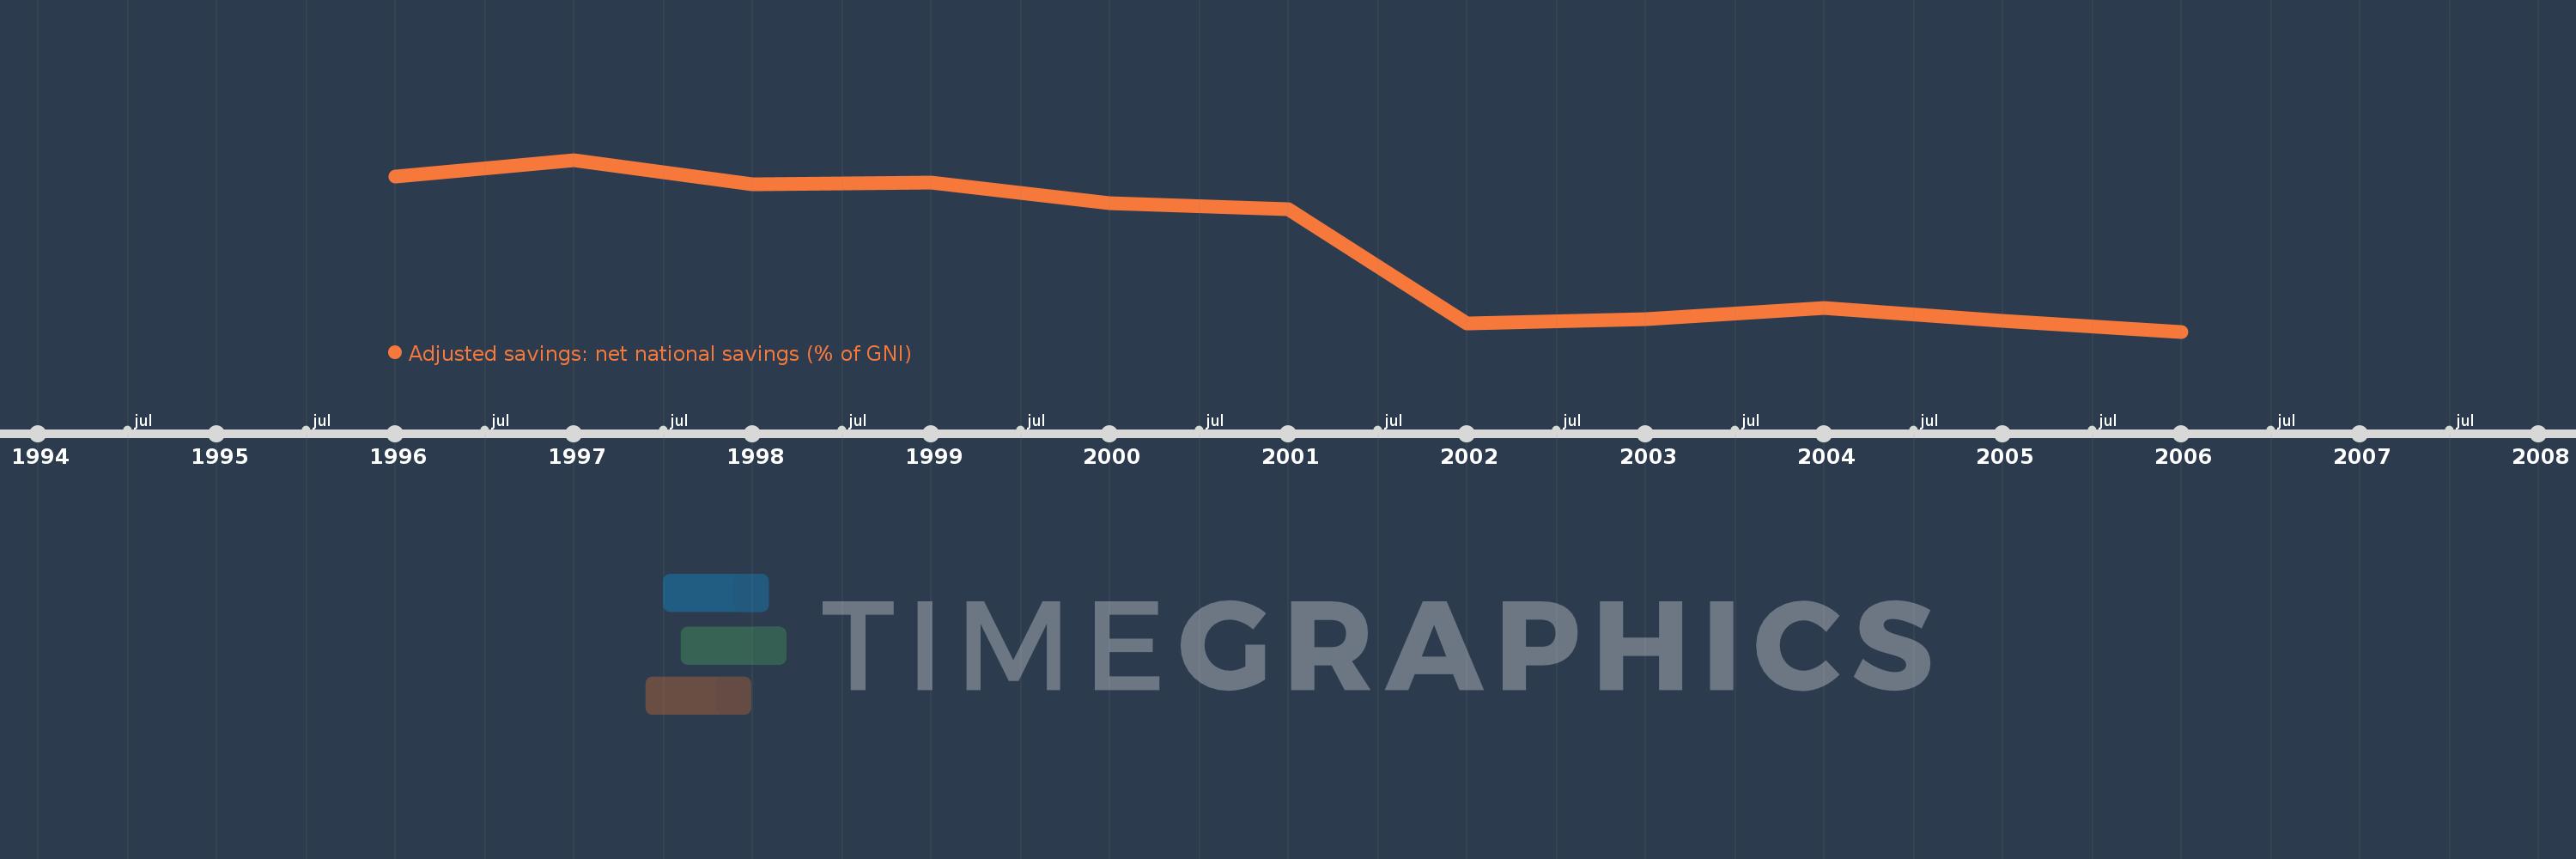
Diese Zeitleiste vorliegt die Graphik ab 1996 J. bis 2006 J. Maldives. Die Angaben bis 1995 J. sind nicht vorhanden. Die Zahl aktueller Beobachtungen nach Daten: 11.

Die Quelle (Bezeichnung):

Kennzahlen der Weltentwicklung

Die Quelle (Einrichtung):

World Bank staff estimates based on sources and methods in World Bank's "The Changing Wealth of Nations: Measuring Sustainable Development in the New Millennium" (2011).

Kategorien:

Economy & Growth, Environment

Es wurde aktualisiert:

23 Apr 2017 Jahr

Kennzahlen der Wertänderungen vom Jahr zum Jahr

im Durchschnitt:
22.311
Minimum:
4.87
1 Jan 2006 Jahr
Maximum:
40.355
1 Jan 1997 Jahr
Zum Datum der Beobachtung
Wert
Absolute Veränderung
Die Veränderung bezüglich dem vorherigen Wert
1 Jan 1996 Jahr
36.899
+36.899
0.0%
1 Jan 1997 Jahr
40.355
+3.456
9.37%
1 Jan 1998 Jahr
35.335
-5.02
-12.44%
1 Jan 1999 Jahr
35.616
+0.281
0.8%
1 Jan 2000 Jahr
31.346
-4.27
-11.99%
1 Jan 2001 Jahr
30.189
-1.157
-3.69%
1 Jan 2002 Jahr
6.583
-23.606
-78.19%
1 Jan 2003 Jahr
7.441
+0.858
13.03%
1 Jan 2004 Jahr
9.765
+2.324
31.23%
1 Jan 2005 Jahr
7.02
-2.746
-28.12%
1 Jan 2006 Jahr
4.87
-2.15
-30.62%

Bewertung der Länder gemäß mit laufender Statistik nach Jahren